Table of contents

Customer experience (CX) is the total perception customers form across every interaction with your brand—from discovery to onboarding to support. This guide is for CX leaders, founders, product teams, and support managers who need a practical way to measure and improve customer experience without guessing. You’ll learn how to map journeys and identify friction, which CX metrics to track (NPS, CSAT, CES, retention, churn), and how to build an operating rhythm to turn feedback into improvements. You’ll also find the templates and metric pages you need to launch faster and standardise your approach.
What is Customer Experience (CX)?
Customer experience is the sum of all interactions, perceptions, and emotions a customer has with your brand throughout their entire journey—from the first moment they discover you to long after they’ve made a purchase.
Unlike customer service, which focuses on specific support interactions, CX encompasses:
- Pre-purchase: How customers discover and research your brand
- Purchase: The buying process across all channels
- Post-purchase: Onboarding, support, and ongoing engagement
- Advocacy: Whether customers recommend you to others
Every touchpoint contributes—your website, marketing emails, sales conversations, product quality, support, even your invoice design.
Where the idea came from
The word “experience” entered business language well before today’s CX programmes, and two books shaped how we think about it.
Jan Carlzon, then president of the airline SAS, described moments of truth — the individual contacts in which a customer forms a verdict on the whole company. His arithmetic was blunt: ten million passengers a year, five employees each, fifteen seconds apiece. The brand is built there, not in advertising (Jan Carlzon, Moments of Truth, Ballinger Publishing, 1987).
A decade later B. Joseph Pine II and James H. Gilmore argued that an experience is a distinct economic offering — as far beyond a service as a service is beyond a commodity. Sell only product function and you compete on price; design an experience and you compete on something far harder to copy (B. Joseph Pine II, James H. Gilmore, The Experience Economy, Harvard Business School Press, 1999).
Both claims carry the same practical consequence for measurement: if the verdict forms across many moments, one annual survey cannot describe it. You have to measure where the experience is actually made.
Why Customer Experience Matters More Than Ever
In a hyper-connected market customers have more choices and higher expectations than ever. A single poor experience can send them to a competitor—and they will tell others about it. Three findings are worth knowing before you plan a CX budget.
Companies systematically overrate their own customer experience. In Bain & Company’s research 80% of firms believed they delivered a superior experience to their customers. 8% of those customers agreed. That gap — the delivery gap — is the single best argument for measuring CX rather than assuming it.
Keeping a customer costs far less than winning a new one. Harvard Business Review puts the difference at 5 to 25 times depending on the industry. That ratio is what decides how much it is worth spending to remove the causes of churn.
Effort predicts loyalty better than delight does. Matthew Dixon’s team showed that trying to “delight” customers rarely increases loyalty, while reducing the effort required to get something done has a far stronger effect — Stop Trying to Delight Your Customers, Harvard Business Review, 2010. The argument was expanded in The Effortless Experience (Matthew Dixon, Nick Toman, Rick DeLisi, Portfolio/Penguin, 2013), which is where the CES metric comes from.
How to read CX statistics
Those three numbers travel round conference decks without a date or a market attached, so it is worth labelling them: the Bain study is from 2005, the effort research from 2010, the retention estimate from 2014, and all three describe the US market. They still point in the right direction. They are not a benchmark you can hold your own score against.
Three traps make CX results incomparable — including against yourself.
The threshold weighs more than reality. CSAT usually counts anyone who answered 4 or 5 on a 1–5 scale as satisfied. Count only the 5s and the score falls by double digits, though nobody changed their mind. The same applies to sentiment: whether lukewarm comments land in neutral or negative moves the number more than any real shift in mood. Pick a threshold once and leave it alone — changing it invalidates the entire history of comparisons.
Scores are not comparable across sources. Reviews attract extremes, support tickets collect problems by definition, and a survey sent after a successful purchase catches the customer at their best moment. The same company can post three very different “CX scores” in one week purely by choosing where to ask.
The average hides the segment. A flat overall number is often one group’s rising satisfaction cancelling out another’s collapse. Until you break it down by segment, channel and journey stage, an average mostly tells you that nothing is happening.
The practical conclusion: the only fully honest reference point is your own previous measurement — same source, same question, same threshold. External benchmarks such as the American Customer Satisfaction Index for the US market, or current research from the XM Institute, are there to sanity-check the order of magnitude, not to hold a team to account.
The Customer Experience Framework
Building world-class CX requires a structured approach. Here’s the framework successful companies use:
1. Understand Your Customers
You can’t deliver great experiences without deeply understanding who your customers are.
How to Build Customer Understanding:
- Create detailed buyer personas based on real data
- Segment customers into groups that behave differently
- Run customer satisfaction surveys to gather feedback
- Analyze behavioral data from your CRM and analytics tools
- Run a Voice of the Customer programme so listening is continuous, not annual
2. Map the Customer Journey
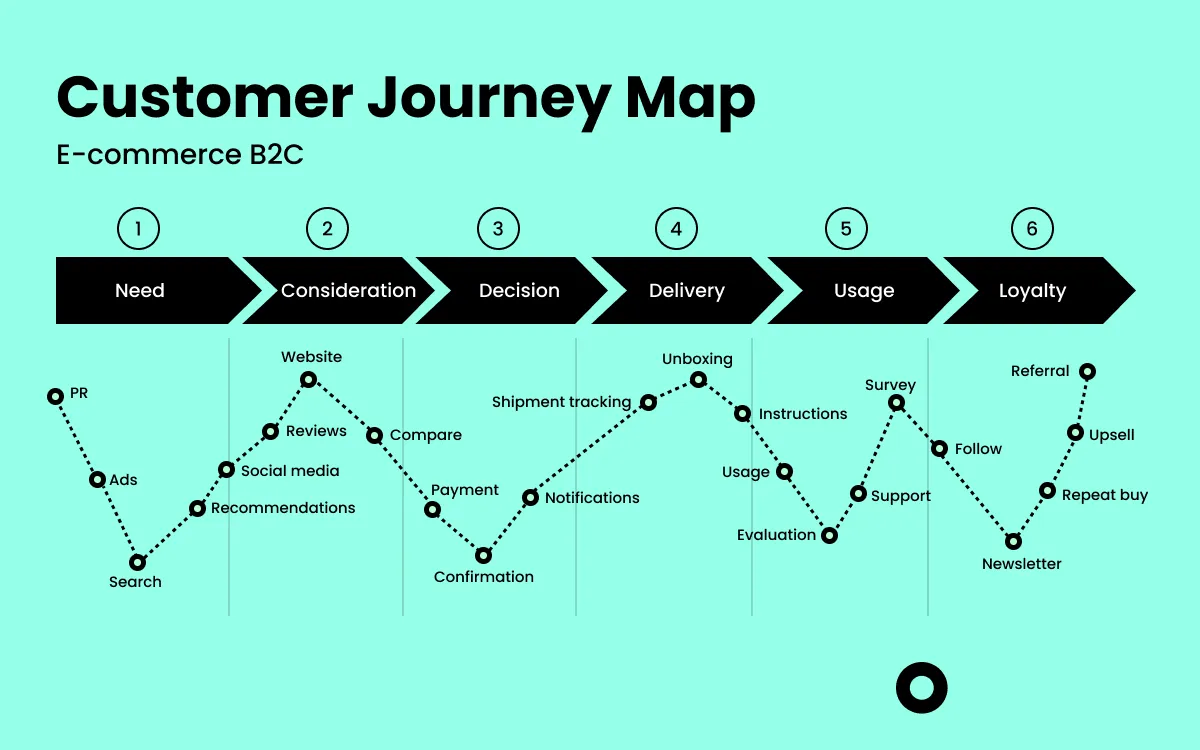
A customer journey map visualizes every interaction a customer has with your brand. It helps you:
- Identify all touchpoints across channels
- Uncover pain points and friction areas
- Spot opportunities for improvement
- Align teams around customer needs
Key Journey Stages:
| Stage | Customer Goal | Key Touchpoints |
|---|---|---|
| Awareness | Discover solutions | Ads, social media, content, referrals |
| Consideration | Evaluate options | Website, reviews, demos, sales calls |
| Purchase | Buy with confidence | Checkout, pricing, payment |
| Onboarding | Get started successfully | Welcome emails, tutorials, setup |
| Retention | Get ongoing value | Product usage, support, updates |
| Advocacy | Share experiences | Reviews, referrals, social sharing |
3. Personalize, and stay consistent across channels
Customers expect you to know them, and to still know them when they switch channel. In practice that means one unified record rather than four partial ones: recommendations based on real behaviour, support agents who can see the history, and messaging that does not contradict itself between marketing, transactional and help content. The test: can a customer switch channel mid-issue without explaining themselves again?
Essential Customer Experience Metrics
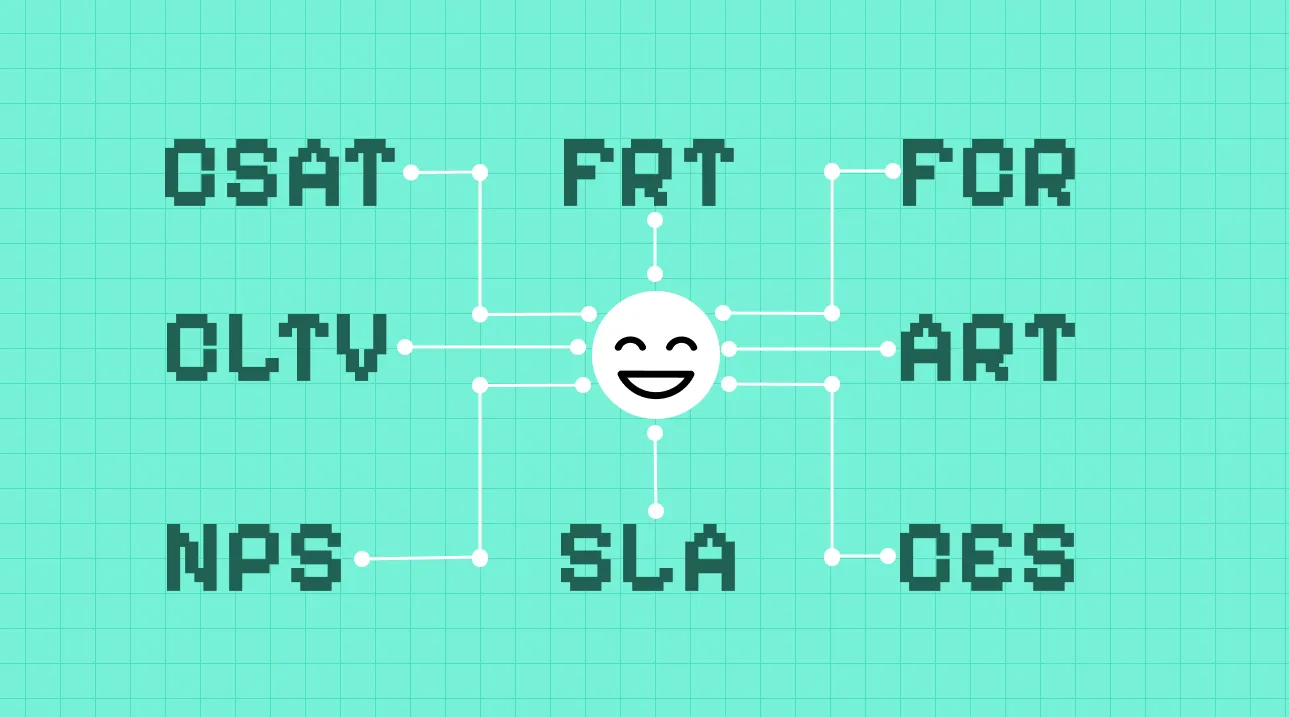
You can’t improve what you don’t measure. Here are the key metrics every CX program should track—and for the full operational picture, see our complete guide to customer service metrics.:
| Metric | What it measures | How to calculate | When to use it |
|---|---|---|---|
| NPS | Loyalty and willingness to recommend | % promoters (9–10) − % detractors (0–6) | Periodically, at relationship level |
| CSAT | Satisfaction with one interaction | Positive responses ÷ total responses × 100 | Immediately after a purchase, delivery or support contact |
| CES | Effort the customer had to spend | Mean of all effort ratings (1–7) | After a process: onboarding, a return, a resolved ticket |
| CLV | Revenue expected across the relationship | Average value × purchase frequency × lifespan | When deciding how much a CX fix is worth |
| Retention rate | Customers who stay over a period | (Customers at end − new) ÷ customers at start × 100 | Continuously, in the product or CRM |
| Churn rate | Customers who leave over a period | Customers lost ÷ customers at start × 100 | Alongside retention, to find experience gaps |
The first three are the ones you actively collect, and each answers a different question: would they recommend you, did this interaction land, and how hard did they have to work. Run them in Responsly on the CSAT and CES pages, or start from the customer satisfaction survey template; and the metric pages carry the question wording and thresholds.
The last three come from systems you already have rather than from asking, and they are what turn a CX score into a business case. Churn is usually where an experience gap surfaces first.
Ask close to the event: a CSAT survey sent three weeks after delivery measures memory, not satisfaction. Relationship NPS is the opposite — it asks about the brand as a whole, so firing it after every minor interaction makes it meaningless.
Where these metrics come from
Each of these was invented to answer a different question and carries its own limits — worth knowing before one of them lands on a board dashboard.
- NPS was introduced by Fred Reichheld, who argued that a single question about willingness to recommend predicts growth better than elaborate satisfaction studies (Fred Reichheld, The Ultimate Question 2.0, Harvard Business Review Press, 2011). The standing objection is that it compresses a complex relationship into one number — which is why the open question underneath the score matters more in practice than the score itself.
- CES comes from the Dixon research described above. It is sharp for transactional processes and weak as a verdict on a whole relationship.
- CSAT is the oldest and most flexible, and for that reason the most context-dependent: the same 1–5 scale means something different after a complaint and after a purchase.
- SERVQUAL takes a different route entirely — instead of one number it measures the gap between expectation and experience across five dimensions of service quality. The scale was published by A. Parasuraman, Valarie Zeithaml and Leonard Berry in the Journal of Retailing (SERVQUAL: A Multiple-Item Scale for Measuring Consumer Perceptions of Service Quality, 1988, 64(1)), and we unpack it in our guide to the SERVQUAL model.
Building Your Customer Experience Strategy

A CX strategy only works with alignment across the whole organisation. Three parts carry most of the weight:
Identify the moments that actually matter
Not all touchpoints carry equal weight. Carlzon’s point holds: a handful of contacts decide the verdict on everything else. Concentrate on first impressions, problem resolution, milestone moments like renewals and upgrades, and the high-emotion interactions — complaints, cancellations, celebrations. Measuring the rest costs responses and buys little.
Give employees the authority to fix things
Front-line teams cannot deliver an experience they are not allowed to repair. That means training and tools, but above all the authority to resolve an issue without escalation — and recognition when they do. A closed loop that needs three approvals is not a closed loop.
Close the loop, and prove that you did
Collect through surveys and conversations, analyse for patterns rather than individual complaints, act on the causes, then go back to the customers who raised them. The last step is the one most programmes skip, and it is the one customers actually notice.
Common Customer Experience Mistakes to Avoid
Learn from others’ mistakes:
Siloed departments. When teams do not share customer data, the customer pays for it by repeating themselves after every handover. Shared CX goals and one view of the customer fix more than any script.
Focusing only on detractors. Complaints are loud, so they get the attention — but the growth usually sits in moving passives to promoters, and nobody is working on them.
Survey fatigue. Bombarding people with questionnaires damages the very experience you are trying to improve. Ask short, ask close to the event, and drop any question that no one owns a decision for.
Ignoring employee experience. Front-line teams cannot deliver an experience they do not have themselves; employee experience and CX move together.
Measuring without acting. Feedback collected and ignored erodes trust twice — with the customer who wrote it, and with the team asked to gather it.
How Responsly supports a CX programme
Responsly covers the collect-understand-act loop in one place:
- Create and distribute surveys across channels
- Collect real-time feedback at key touchpoints
- Analyze sentiment and trends
- Trigger alerts for immediate follow-up
For teams running this end to end, our customer experience platform ties collection, AI analysis and closing the loop to NPS, CSAT and the full journey.
Conclusion
Customer experience is a way of managing the whole relationship, not the name of a survey. A good programme ties NPS, CSAT, CES, retention behaviour and open comments to actions with owners on them.
You do not need to transform everything at once. A realistic first quarter looks like this: two weeks auditing the touchpoints and feedback you already have, two weeks mapping one journey and picking the metrics you will act on, a month running a short survey on a single touchpoint with an agreed owner for low scores, and a final month fixing one cause and re-measuring. Compare the result against your own previous number, not somebody else’s average.
Ready to elevate your customer experience? Create a free Responsly account and start collecting customer feedback today. Use our ready-made templates to launch NPS, CSAT, and CES surveys in minutes.
FAQ
What is the difference between customer experience and customer service?
How do you measure customer experience?
Why is customer experience important for business growth?
What are the key components of customer experience?
Can you compare your CX score against an industry benchmark?
How long does it take to see results from a CX programme?
Tagged in
Last updated