Karol Koronowicz
Human Experience Specialist
![]() 7 min read
7 min read
Listen and understand your customers. Win them at any stage of their journey.
cx Platform

The Customer Satisfaction Index (CSI) is a composite metric that quantifies how well your products, services, and overall experience meet customer expectations. Unlike single-question metrics like NPS or CSAT, CSI aggregates multiple satisfaction factors into one strategic score.
This guide is for CX leaders, product managers, and customer success teams who want to understand the full picture of customer sentiment—not just a single touchpoint. You’ll learn what CSI is, how to calculate it using a weighted formula, how it compares to other satisfaction metrics, and how to build a CSI program using tools like Responsly. We’ll also cover actionable benchmarks and common pitfalls to avoid.
What is the Customer Satisfaction Index (CSI)?
The Customer Satisfaction Index is a structured measurement system that evaluates customer satisfaction across multiple dimensions. Rather than asking a single question, CSI surveys ask customers to rate several attributes of their experience—such as product quality, price, service speed, and staff friendliness—and then combines these into a single index score.
CSI is commonly used in industries like:
- Automotive: Measuring satisfaction with dealerships and service centers.
- Banking & Finance: Assessing branch experience, digital banking, and support quality.
- Retail & E-commerce: Evaluating product, delivery, and returns experience.
- Telecommunications: Tracking network quality, billing clarity, and customer service.
The power of CSI lies in its diagnostic capability. If your overall index drops, you can pinpoint which specific attribute drove the decline, making it easier to prioritize improvements.
CSI vs. CSAT vs. NPS vs. CES: What’s the Difference?
Before diving into calculation, it’s important to understand how CSI fits into the broader CX metrics landscape.
| Metric | Full Name | What It Measures | Question Type | Best For |
|---|---|---|---|---|
| CSI | Customer Satisfaction Index | Overall weighted satisfaction across multiple factors | Multi-attribute survey | Holistic strategic view |
| CSAT | Customer Satisfaction Score | Satisfaction with a specific interaction | ”How satisfied were you?” (1-5 scale) | Transactional feedback |
| NPS | Net Promoter Score | Likelihood to recommend | ”How likely are you to recommend?” (0-10) | Loyalty & growth prediction |
| CES | Customer Effort Score | Ease of completing a task | ”How easy was it to…?” (1-7 scale) | Process optimization |
Key Takeaway: Use CSI when you need a comprehensive, multi-dimensional view of satisfaction. Use CSAT for quick, transactional checks. Use NPS to measure loyalty and advocacy potential. Use CES to identify friction in specific processes.
How to Calculate the Customer Satisfaction Index (CSI)
There are two common methods for calculating CSI: the simple average method and the weighted method. The weighted method is more strategic because it accounts for the relative importance of each attribute.
Method 1: Simple Average CSI
This method calculates the average of all satisfaction ratings without weighting.
Example:
- Product Quality: 4.2 / 5
- Delivery Speed: 3.8 / 5
- Customer Service: 4.5 / 5
Method 2: Weighted CSI (Recommended)
This method assigns importance weights to each attribute, reflecting which factors matter most to customers.
Example (Weights determined by customer importance survey):
| Attribute | Satisfaction (1-5) | Weight | Score × Weight |
|---|---|---|---|
| Product Quality | 4.2 | 0.40 | 1.68 |
| Delivery Speed | 3.8 | 0.35 | 1.33 |
| Customer Service | 4.5 | 0.25 | 1.125 |
| Total | 1.00 | 4.135 |
The weighted method is more accurate because it reflects the true priorities of your customers. A small dip in “Product Quality” (weight 0.40) will impact your index more than a similar dip in “Customer Service” (weight 0.25).
How to Determine Attribute Weights
The weights shouldn’t be guessed. Use one of these methods:
- Importance Survey: Ask customers directly: “How important is [Attribute] to your overall satisfaction?” (1-5 scale). Calculate the weight as each attribute’s average importance score divided by the sum of all scores.
- Statistical Regression: Analyze past data to see which attributes correlate most strongly with overall satisfaction or repurchase behavior.
- Conjoint Analysis: Use a dedicated market research technique to determine trade-off preferences.
For most teams, the Importance Survey method is the best balance of accuracy and simplicity. You can run this survey once a year and use the results to weight your ongoing CSI tracking.
Benefits of Tracking the Customer Satisfaction Index
Why invest in a multi-attribute CSI program instead of just using a simple CSAT?
1. Diagnostic Power
When your score drops, you know exactly which factor caused it. This eliminates guesswork and allows you to allocate resources effectively.
2. Prioritization
The weighted model tells you where to focus. If “Delivery Speed” has a high weight but a low score, that’s your biggest opportunity for improvement.
3. Trend Tracking
CSI is designed for longitudinal tracking. You can compare your index quarter-over-quarter to see if strategic initiatives are moving the needle.
4. Cross-Segment Comparison
You can calculate CSI for different customer segments (e.g., Enterprise vs. SMB) and identify where satisfaction gaps exist.
5. Alignment with Business Outcomes
A well-constructed CSI correlates strongly with retention and revenue. Research consistently shows that a 1-point improvement in satisfaction index can drive a measurable increase in customer lifetime value.
Building a CSI Program: Step-by-Step
Here’s a practical framework for implementing a Customer Satisfaction Index program using Responsly.
Step 1: Define Your Attributes
Identify the 4-8 key dimensions of your customer experience. Common examples:
- Product/Service Quality
- Value for Money
- Ease of Purchase
- Customer Support
- Delivery/Fulfillment
- Communication
Step 2: Design Your Survey
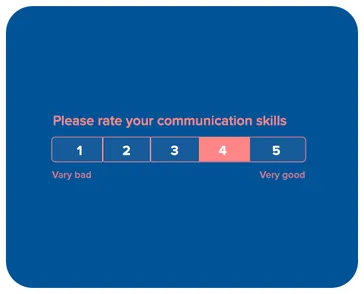
Create a customer satisfaction survey that asks customers to rate each attribute on a 1-5 or 1-10 scale. Include an open-ended question at the end for qualitative context (“What could we do better?”).
Step 3: Determine Weights
Run a one-time “Importance Survey” asking customers to rate how important each attribute is. Use these ratings to calculate your weights.
Step 4: Distribute and Collect
Send your survey at strategic moments:
- Relationship CSI: Quarterly or bi-annually to a sample of your customer base.
- Transactional CSI: After key touchpoints (e.g., post-purchase, post-support ticket).
Use email surveys, shareable links, or website pop-ups depending on your customer’s preferred channel.
Step 5: Calculate and Analyze
Apply the weighted formula to calculate your index. Use Responsly’s analytics dashboard to track trends over time and segment results by customer type, region, or product line.
Step 6: Act and Close the Loop
Share findings with relevant teams. If “Customer Support” is dragging down your score, work with your support team to address the root cause. Then, follow up with dissatisfied customers to close the feedback loop.
Common Mistakes to Avoid
- Too Many Attributes: Asking about 15 factors leads to survey fatigue and low completion rates. Keep it to 4-8.
- Static Weights: Customer priorities change. Re-evaluate your weights annually.
- Ignoring Open-Ended Feedback: The “Why” behind the score is often more valuable than the number itself.
- Measuring Without Acting: Tracking a score that never informs decisions is a waste of resources. Tie CSI to accountability.
Industry Benchmarks for CSI
While benchmarks vary, here are general guidelines:
| CSI Score | Interpretation |
|---|---|
| 90%+ | World-class; customers are delighted. |
| 80-89% | Excellent; strong competitive advantage. |
| 70-79% | Good; room for targeted improvement. |
| 60-69% | Average; risk of churn in competitive markets. |
| Below 60% | Poor; urgent intervention required. |
For specific industry benchmarks, consult reports from organizations like ACSI (American Customer Satisfaction Index) or J.D. Power.
How Responsly Helps You Measure CSI
Building a CSI program from scratch can be complex. Responsly simplifies the process with:
- AI Survey Generator: Quickly create multi-attribute satisfaction surveys tailored to your industry.
- Weighted Scoring: Calculate CSI automatically with custom weights.
- Real-Time Dashboards: Track your index over time and compare segments.
- Text Analysis: AI summarizes open-ended responses to identify themes.
- Omnichannel Distribution: Reach customers via email, SMS, and website widgets.
Ready to build your Customer Satisfaction Index?
Start measuring CSI for free with Responsly
Summary
The Customer Satisfaction Index (CSI) is a powerful metric for understanding the full picture of your customer experience. Unlike single-question metrics, it provides diagnostic depth by aggregating multiple weighted attributes into one strategic score.
Key Takeaways:
- CSI measures satisfaction across multiple factors, weighted by importance.
- Use the weighted formula for accurate, actionable insights.
- Track CSI over time to measure the impact of your CX initiatives.
- Combine with NPS and CSAT for a complete measurement system.
By building a robust CSI program, you can move from reacting to customer complaints to proactively optimizing the experiences that matter most.