Karol Koronowicz
Human Experience Specialist
![]() 5 min read
5 min read


The Likert scale is one of the most powerful tools in a researcher’s arsenal, allowing you to measure attitudes, opinions, and perceptions with precision. Unlike simple “yes/no” questions, a Likert scale captures the nuance of human sentiment—whether it’s customer satisfaction, employee engagement, or market trends. In this guide, we’ll cover everything you need to know: from the definition and history to the difference between 5-point and 7-point scales, and how to analyze the data effectively.
What is a Likert Scale? Definition and History
Named after its creator, psychologist Rensis Likert, who introduced it in 1932, the Likert scale was designed to measure “attitudes” scientifically.
A standard Likert scale question consists of two parts:
The Statement: A specific assertion about the subject (e.g., “The customer service was helpful”).
The Scale (Response Options): An ordered set of options ranging from one extreme to another (e.g., “Strongly Disagree” to “Strongly Agree”).
It is a bipolar scale, meaning it has two opposite poles (negative and positive) with a neutral point in the middle. This structure allows respondents to express the intensity of their feelings.
How to Construct a Likert Scale Question
A well-designed Likert question is clear, balanced, and easy to understand.
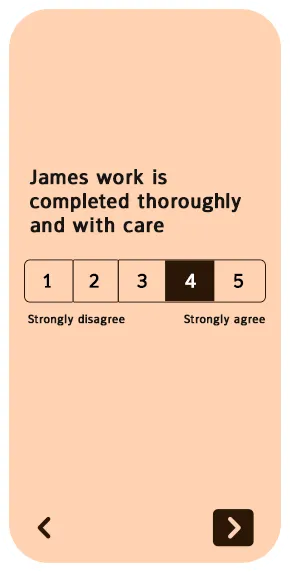
Example Question:Typical 5-Point Scale:“To what extent do you agree with the following statement: The software is easy to use.”
- Strongly Disagree
- Disagree
- Neither Agree nor Disagree (Neutral)
- Agree
- Strongly Agree
Common Variations of the Scale
Likert scales aren’t just for agreement. They can measure frequency, quality, importance, and satisfaction.
| Scale Type | 1 (Minimum) | 2 | 3 (Neutral) | 4 | 5 (Maximum) |
|---|---|---|---|---|---|
| Agreement | Strongly Disagree | Disagree | Neither Agree nor Disagree | Agree | Strongly Agree |
| Frequency | Never | Rarely | Sometimes | Often | Always |
| Quality | Very Poor | Poor | Average | Good | Excellent |
| Importance | Not Important | Slightly Important | Moderately Important | Important | Very Important |
| Satisfaction | Very Dissatisfied | Dissatisfied | Neutral | Satisfied | Very Satisfied |
5-Point vs. 7-Point Likert Scales: Which to Choose?
Choosing the right number of points is critical for data quality.
5-Point Scale
This is the “gold standard” for most online surveys, including customer feedback.
Pros: Easy for respondents to understand, works great on mobile devices, sufficient for general insights.
Cons: Less granular than larger scales.
7-Point Scale
Adds two intermediate points (e.g., “Somewhat Disagree”, “Somewhat Agree”).
Pros: Provides more precision and better statistical distribution; ideal for academic or complex research.
Cons: Increases cognitive load; can be overwhelming on small screens.
Even Scales (4-Point or 6-Point) - Forced Choice
Sometimes researchers remove the neutral option to force a positive or negative stance. This avoids the “central tendency bias” where respondents pick the safe middle option, but it risks frustrating users who genuinely have no opinion.
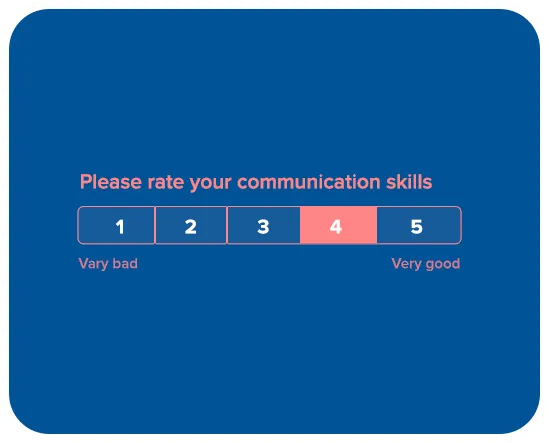
Visual Likert Scales: Stars and Smileys

In the era of mobile-first surveys, reading text options can be tedious. Modern survey tools like Responsly use visual representations to improve engagement.
Star Ratings: Instantly recognizable. 1 star is bad, 5 stars is good.
Smileys (CSAT): Uses facial expressions (angry to happy) to convey emotion without words.
Sliders: Allows for a granular 0-10 or 0-100 rating.
Pro Tip: Use visual scales for simple metrics like Customer Satisfaction (CSAT) to boost response rates on mobile.
How to Analyze Likert Scale Data
Collecting data is just the first step. Here is how to turn numbers into insights.
1. The Mean (Average)
Assign a number to each option (1-5) and calculate the average.
Example: “Our ease of use score is 4.2/5.”
Best for: Quick comparisons between different questions.
2. Top 2 Box (T2B)
Focus on the percentage of respondents who chose the top two positive options (e.g., “Agree” and “Strongly Agree”).
- Why? In business, you want to know who your happy customers are. A high average means nothing if you have no passionate advocates.
3. Net Promoter Score (NPS)
While strictly an 11-point scale (0-10), NPS follows similar principles but groups users into Detractors, Passives, and Promoters to calculate a single loyalty score.
How to Create a Likert Scale Survey in 6 Steps
Based on best practices, here is a workflow to launch your survey:
Define Objectives: Know exactly what you are measuring (e.g., “Employee satisfaction with the new office”).
Draft Statements: Write clear, unbiased statements. Avoid “double-barreled” questions (e.g., “The food and service were good” – what if the food was good but service bad?).
Choose the Scale: Stick to a 5-point scale for general audiences and a 7-point scale for deep research.
Balance the Options: Ensure you have equal positive and negative options and a clear neutral point.
Use a Tool: Use a platform like Responsly to select pre-made Likert scale templates.
Analyze & Act: Look at the Top 2 Box scores and take action on the feedback.
Summary
The Likert scale remains the standard for understanding human sentiment in a quantifiable way. Whether you are running an Employee Experience survey or measuring brand perception, choosing the right scale and question wording is key to getting actionable data.
Ready to start measuring? Create a free account with Responsly and use our ready-made templates to launch your first Likert scale survey in minutes.