Karol Koronowicz
Human Experience Specialist
![]() 13 min read
13 min read

Good survey and form design is the foundation of valuable research. The way you structure questions, organize your survey or form, and present it to respondents directly impacts the quality of data you collect — and how many people actually complete it. In this comprehensive guide, we’ll walk you through everything you need to know about creating effective online surveys and forms that get results.
What is Survey Design?
Survey design refers to the systematic process of creating a well-structured questionnaire, survey, or form intended to collect specific information from a group of respondents. It involves careful planning and consideration of various factors — including question types, survey length, visual layout, and data security — to ensure the survey or form gathers accurate, relevant, and actionable data.
Whether you’re running a customer satisfaction survey, an employee engagement poll, academic research, or a product feedback form, good survey design directly determines the quality of insights you receive.
Why Survey Design Matters More Than Ever in 2026
With the rise of AI-powered survey tools and increasingly selective respondents, the bar for effective survey design has never been higher. Modern surveys must compete for attention on mobile devices, adapt to respondent behavior in real time, and be designed to minimize bias and fatigue. Research shows that completion rates drop sharply for surveys longer than 15 minutes, and with AI Overviews now surfacing direct answers for common research questions, your survey needs to be easy to find, easy to complete, and built on sound methodology.
10 Steps to Effective Survey Design
Creating a good survey or form is crucial to gather valuable insights and accurate data. Follow these 10 steps to ensure your questionnaire is effective and yields meaningful results:
1. Define Your Objectives
Clarify the purpose of your survey and the specific information you want to gather. Clearly outline the research goals and the questions you aim to answer. Without a clear objective, you risk collecting data that looks useful but doesn’t drive any real decisions.
Ask yourself:
- What decisions will this data inform?
- What specific insights do I need?
- How will I use the results?
- What is the minimum data I need to answer my core question?
2. Identify Your Target Audience
Understand who your respondents are and tailor the survey to their characteristics and preferences. Knowing your audience helps in framing relevant questions and significantly increases response rates. A survey designed for technical experts will look very different from one aimed at general consumers.
Consider:
- Demographics (age, location, profession)
- Technical proficiency and language preferences
- Available time and preferred devices (desktop vs. mobile)
- Any incentives that may encourage participation
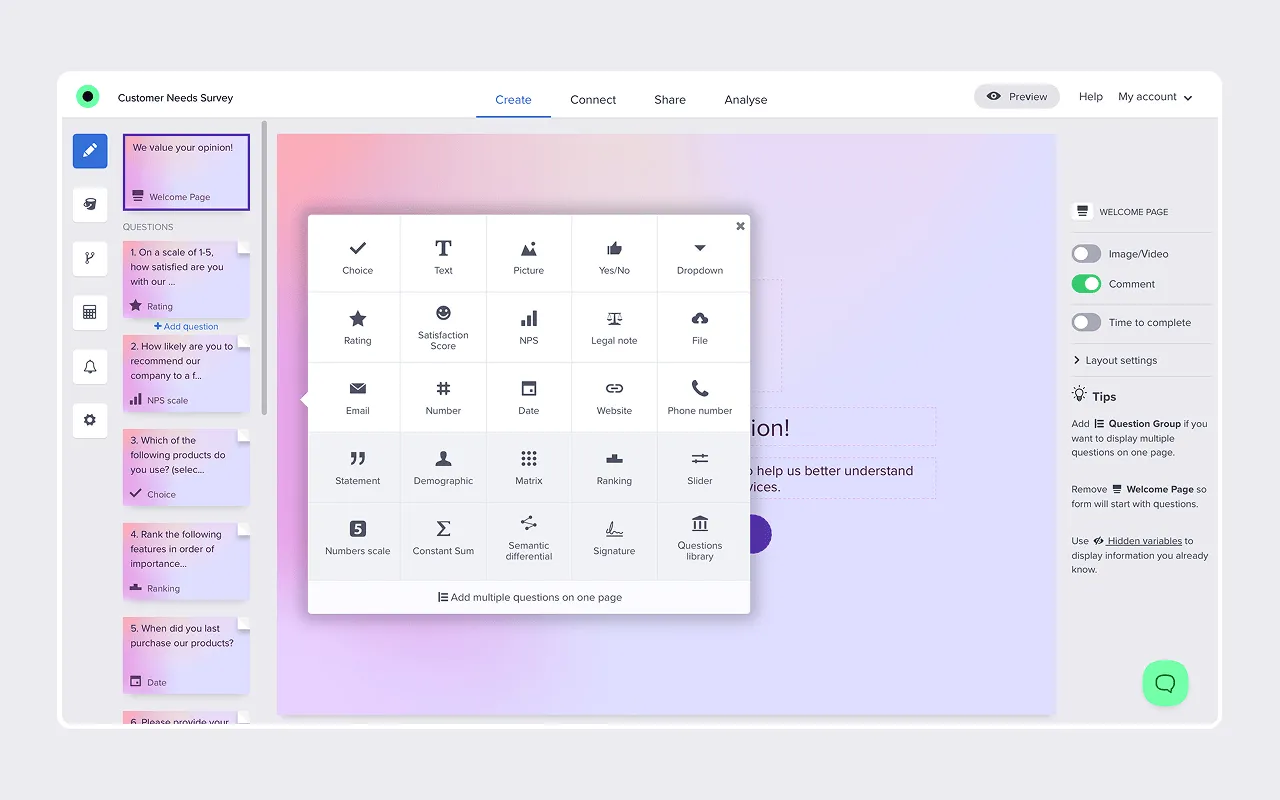
3. Choose the Right Question Types
Select appropriate question formats based on your research objectives. Use closed-ended questions for quantitative data and open-ended questions for qualitative insights. Mixing question types keeps respondents engaged and yields richer data.
Common types include:
- Multiple choice — fast to answer, easy to analyze
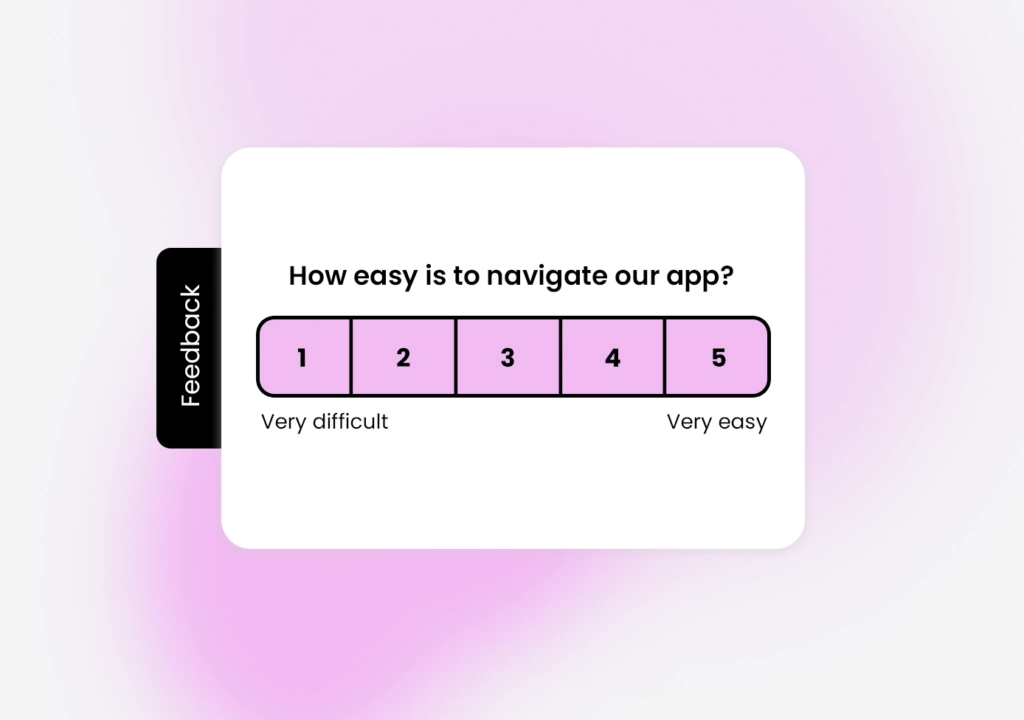
- Likert scale — ideal for attitudes, satisfaction, and opinions
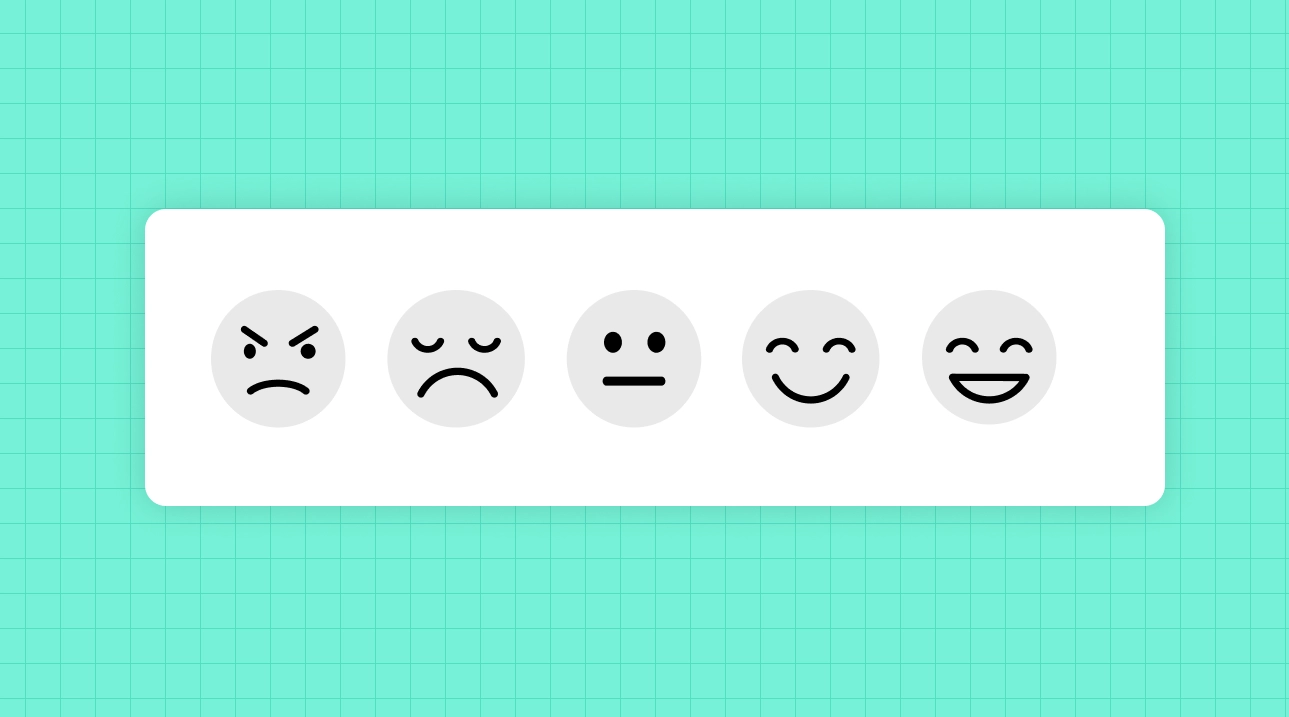
- Rating scales — useful for NPS, product ratings, and prioritization
- Open-ended — captures nuanced, qualitative feedback
- Matrix questions — efficient for comparing multiple items on one scale
4. Craft Clear and Concise Questions
Write questions that are easy to understand and free from ambiguity or bias. Keep the language simple and straightforward to ensure respondents can provide accurate answers. Ambiguous questions are one of the most common causes of unreliable survey data.
Best practices:
- Use simple, everyday language — avoid jargon
- Avoid double-barreled questions (asking two things at once)
- Be specific about timeframes (“In the last 30 days…” vs. “Recently…”)
- Eliminate leading or loaded questions that hint at a preferred answer
5. Optimize Survey Length
Keep your survey or form concise and focused. Aim for 5–10 minutes completion time for general audiences. Longer surveys and forms lead to lower completion rates, respondent fatigue, and less reliable answers toward the end. Prioritize essential questions ruthlessly — every “nice-to-have” question is a risk to your data quality.
Guidelines:
- 10–15 questions is ideal for most online surveys
- Use progress indicators so respondents know how much is left
- Remove redundant or overlapping questions
- Consider splitting a long survey into multiple shorter waves
6. Organize Questions Logically
Structure your survey in a logical flow, moving from general to specific topics. Ensure that questions follow a coherent sequence for a smoother experience. A well-organized survey feels like a natural conversation, not an interrogation.
Tips:
- Start with easy, engaging warm-up questions
- Group related questions into sections with clear headings
- Place sensitive or personal questions later, after rapport is established
- End with demographic questions (age, role, location) — they feel less intrusive at the end
7. Provide Diverse and Balanced Response Options
Offer a variety of response choices to capture different perspectives. Make sure answer options are mutually exclusive (no overlap) and collectively exhaustive (cover all possible answers). Include “Other,” “Not Applicable,” or “Don’t know” options where relevant.
Remember to:
- Use balanced scales (equal positive and negative options)
- Avoid acquiescence bias by mixing positive/negative phrasing
- Offer a neutral midpoint on attitude scales when appropriate
- Use 5–7 point scales for optimal measurement precision
8. Design a Mobile-First, User-Friendly Interface
In 2026, more than half of all survey and form responses come from mobile devices. Creating a mobile-friendly survey or form is no longer optional — it’s a baseline requirement for reaching a representative audience. A poorly formatted mobile experience is one of the fastest ways to kill your response rate.
Design elements:
- Responsive layout that adapts to all screen sizes
- Large, tap-friendly buttons and answer areas
- One question per screen on mobile where possible
- Clear navigation and visual progress indicators
- Consistent branding to build trust and recognition
9. Conduct Pilot Testing Before Launch
Before launching to your full audience, conduct a small-scale pilot test with 5–10 representative participants. This uncovers issues with question clarity, survey flow, technical bugs, and completion time that you may have missed during design.
Test for:
- Question clarity and potential misinterpretation
- Technical issues across different devices and browsers
- Actual completion time (use cognitive interviewing or think-aloud testing)
- Unexpected response patterns that suggest question problems
10. Ensure Data Security and Respondent Privacy
Privacy is not just a legal requirement — it’s a trust signal that directly affects response rates. Respondents are more likely to answer honestly when they know their data is protected. Clearly communicate how data will be used and stored before the survey begins.
Security measures:
- SSL encryption on all survey pages
- GDPR and relevant regional compliance
- Clear, plain-language privacy policy
- Anonymous response option where possible
- Secure data storage with access controls
Popular Question Types in Survey Design
Understanding which question types to use — and when — is one of the most important skills in survey design. Here’s a quick overview of the most effective formats:
Multiple-Choice Questions Participants choose from a list of predefined options. This format is fast to answer, easy to analyze, and ideal for gathering quantitative data at scale. Best for: demographics, preferences, categorical data.
Likert Scale Questions Participants rate their level of agreement with a statement on a scale (e.g., “Strongly Disagree” to “Strongly Agree”). Likert scales are the gold standard for measuring attitudes, opinions, and satisfaction. Best for: employee engagement, customer satisfaction, brand perception.
Open-Ended Questions Respondents provide free-text answers in their own words. Open-ended questions deliver rich qualitative data and are especially powerful when analyzed with AI-powered text analysis tools. Best for: feedback, suggestions, understanding the “why” behind scores.
Rating or Ranking Questions Participants assign ratings or rankings to items, allowing you to compare preferences or assess importance. Best for: product feature prioritization, comparing options, competitive research.
Demographic Questions These collect basic information about respondents (age, gender, occupation, location), enabling data segmentation and deeper analysis. Always place demographic questions at the end unless they are used for screening.
Yes/No Questions Simple binary questions that are quick to answer and easy to analyze. Best for: screening, confirming eligibility, and quick-pulse checks.
Matrix or Grid Questions A series of items rated on the same scale in a compact format. Efficient for covering multiple dimensions in a single question block — but use sparingly on mobile, as they can be difficult to interact with on small screens.
Net Promoter Score (NPS) Questions The classic 0–10 likelihood-to-recommend scale. NPS is one of the most widely used customer loyalty metrics in the world, and it benchmarks easily against industry data. Best for: customer experience, product satisfaction, and loyalty tracking.
Semantic Differential Scale Questions Respondents rate items based on opposing adjectives (e.g., “Confusing / Clear,” “Expensive / Affordable”). Useful for brand perception research and concept testing.
Forced Choice Questions Participants must select only one option from a list of equally attractive choices, revealing true preferences. Best for: prioritization research and tradeoff analysis.
How to Write Great Survey Questions: 5 Tips
Writing high-quality questions is at the heart of effective survey design. Poor question wording is the #1 cause of unreliable survey data.
1. Be Clear and Specific
Use straightforward language and avoid ambiguity. Ensure respondents clearly understand what is being asked and can provide accurate, consistent answers. If a question can be interpreted in more than one way, rewrite it.
2. Stay Neutral and Unbiased
Keep questions neutral and free from leading language. Even subtle word choices — like “don’t you think” or “how satisfied are you with our excellent service” — can skew results significantly.
3. Use Appropriate Question Types
Match the question type to what you’re measuring. Closed-ended questions for data you need to quantify. Open-ended questions for context, explanation, or ideas you haven’t anticipated.
4. Keep It Short and Relevant
Every question should earn its place. Ask yourself: “If I removed this question, would my research suffer?” If the answer is no, cut it. Lean surveys outperform long ones in every measure — completion rate, data quality, and respondent experience.
5. Pilot Test Your Questions
Before launching, run your survey past 5–10 people from your target audience. Ask them to think aloud as they answer. You’ll discover misinterpretations, confusing wording, and missing response options far more efficiently than any internal review.
How to Boost Survey Response Rates in 2026
Getting people to actually complete your survey or form is just as important as designing it well. Here are the most effective strategies for improving response rates:
- Optimize for mobile — Over half of surveys are now completed on smartphones. A broken mobile experience kills response rates instantly.
- Send at the right time — Mid-week mornings (Tuesday–Thursday, 9–11am) typically see the best open and completion rates. Avoid holidays and Mondays.
- Personalize your invitation — Emails with the respondent’s name and a relevant, specific subject line outperform generic blasts.
- Keep it short — Aim for under 10 minutes. Clearly state the expected completion time in your invitation.
- Use progress indicators — Showing respondents how far they’ve come reduces abandonment rates.
- Use AI-powered adaptive surveys — Modern AI survey tools can shorten perceived survey length by showing only the most relevant follow-up questions based on previous answers.
- Follow up once — A single, well-timed reminder can increase response rates by 15–20%. More than that risks annoying your audience.
- Offer a small incentive — Even a chance to win a gift card meaningfully improves participation for hard-to-reach groups.
AI Survey Tools: How Artificial Intelligence Is Changing Survey Design
Artificial intelligence is transforming how surveys and forms are created, distributed, and analyzed. In 2026, AI-powered survey and form tools are no longer a novelty — they’re becoming a standard part of the research toolkit.
Key ways AI is improving survey design:
AI question generation — Tools like Typeform, Responsly, and Blocksurvey can generate complete survey drafts from a research brief in seconds, dramatically reducing setup time.
Adaptive questioning — AI algorithms analyze responses in real time and skip irrelevant questions, creating a personalized experience that keeps respondents engaged and reduces survey fatigue.
Automated response analysis — AI can code open-ended responses into themes, detect sentiment, and surface key insights from qualitative data — tasks that previously required hours of manual work.
Bias detection — AI writing assistants can flag leading, double-barreled, or ambiguous questions during the design phase, before you collect any data.
While AI can significantly accelerate and enhance the survey process, human oversight remains essential. AI-generated questions still require review, and strategic decisions about research objectives should always be made by a researcher who understands the context.
Top AI survey tools in 2026:
Responsly — Intuitive survey builder with AI-assisted question generation, skip logic, and 25+ question types. Good fit for teams that want fast setup, workflow automation, and real-time analytics without a steep learning curve.
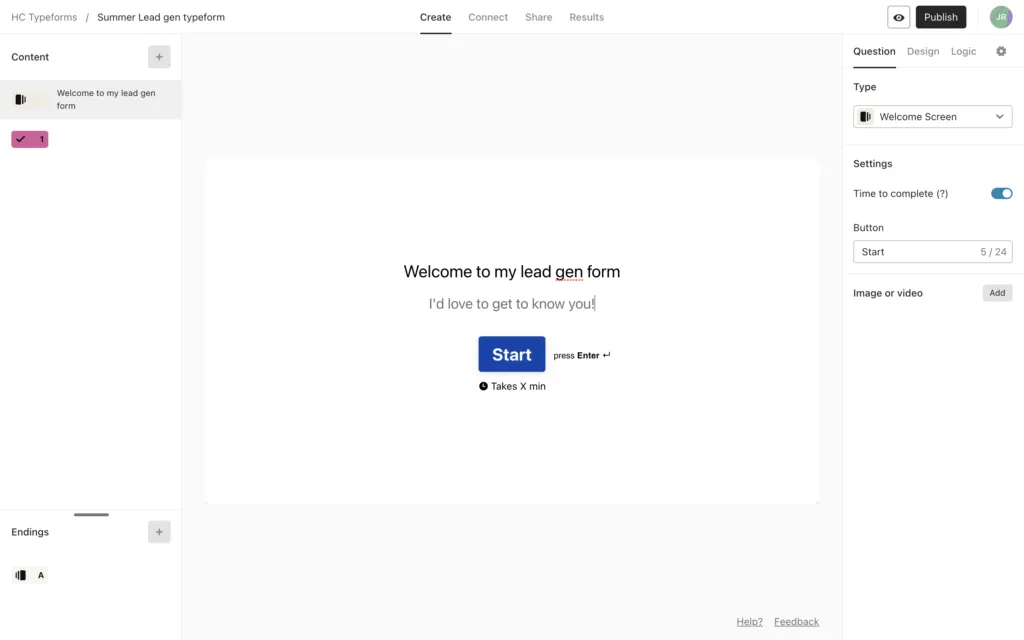
Typeform — Strong conversational UX with a broad AI suite for form creation, adaptive follow-up questions, and AI-powered analysis of qualitative and quantitative responses. Great when completion rate and brand experience are top priorities.
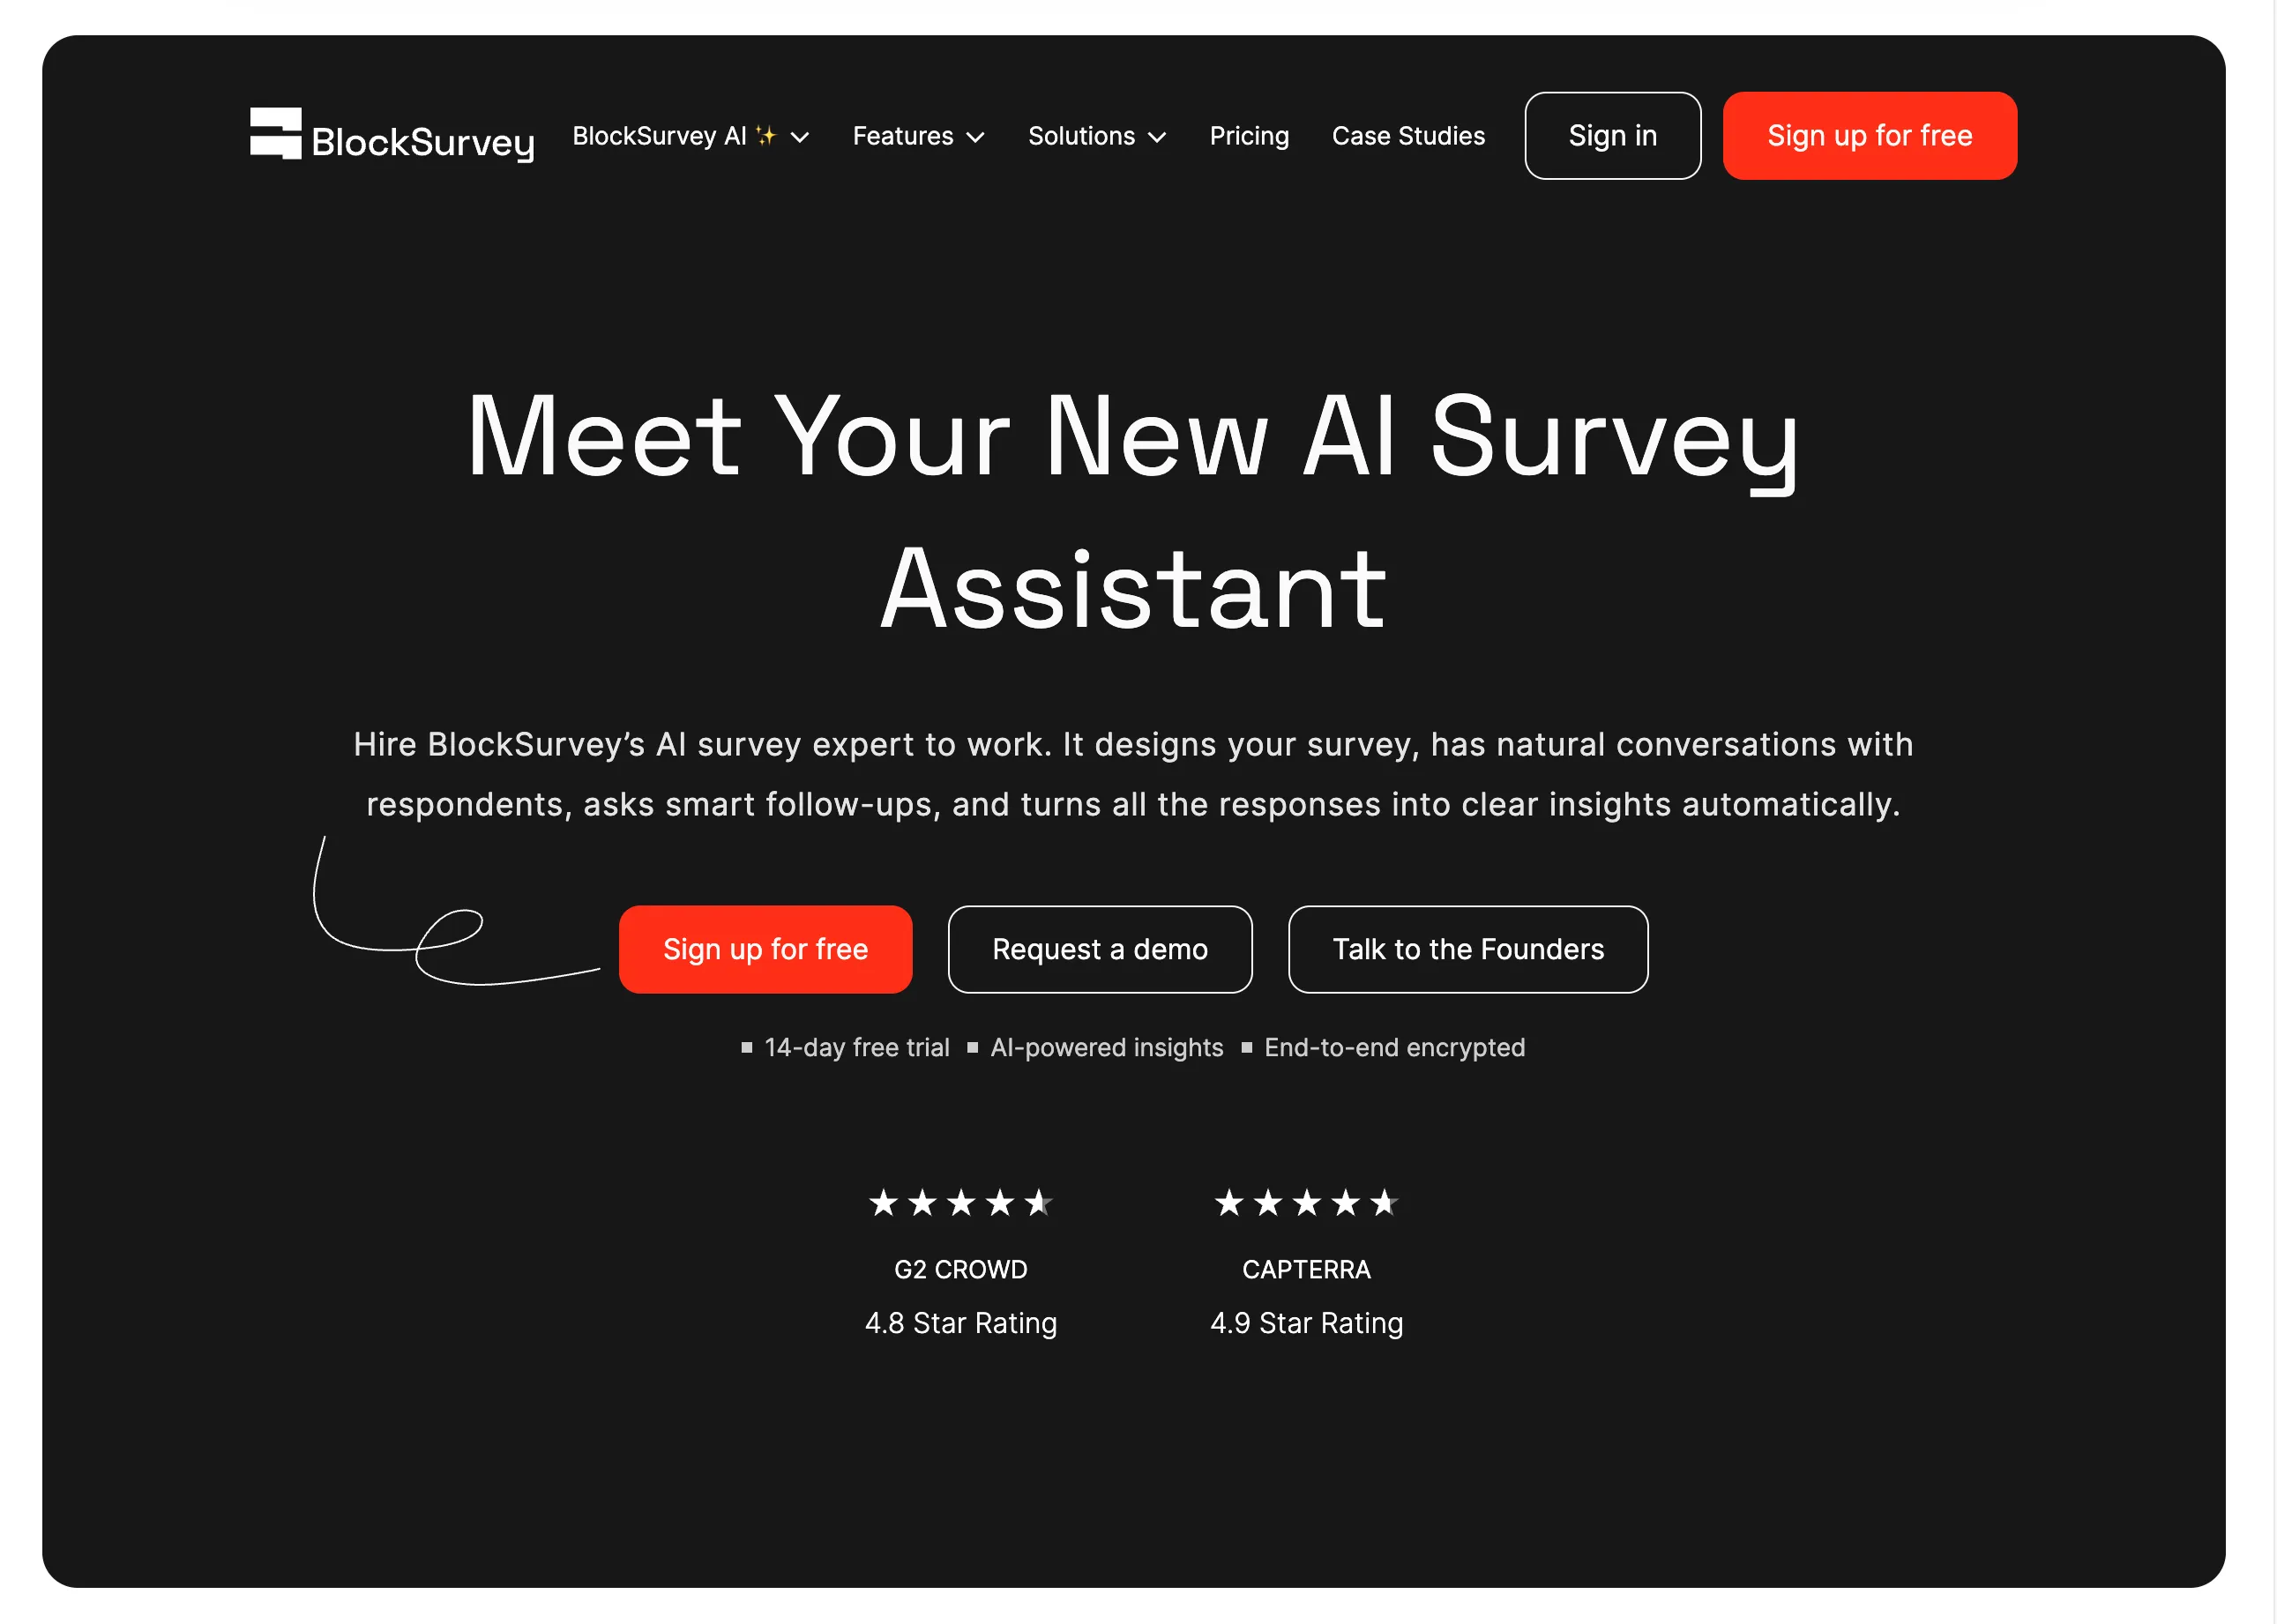
BlockSurvey — Privacy-first platform focused on end-to-end encrypted surveys, no trackers, and compliance-oriented workflows (including GDPR/HIPAA positioning). Best for sensitive feedback projects where data ownership and confidentiality are critical.
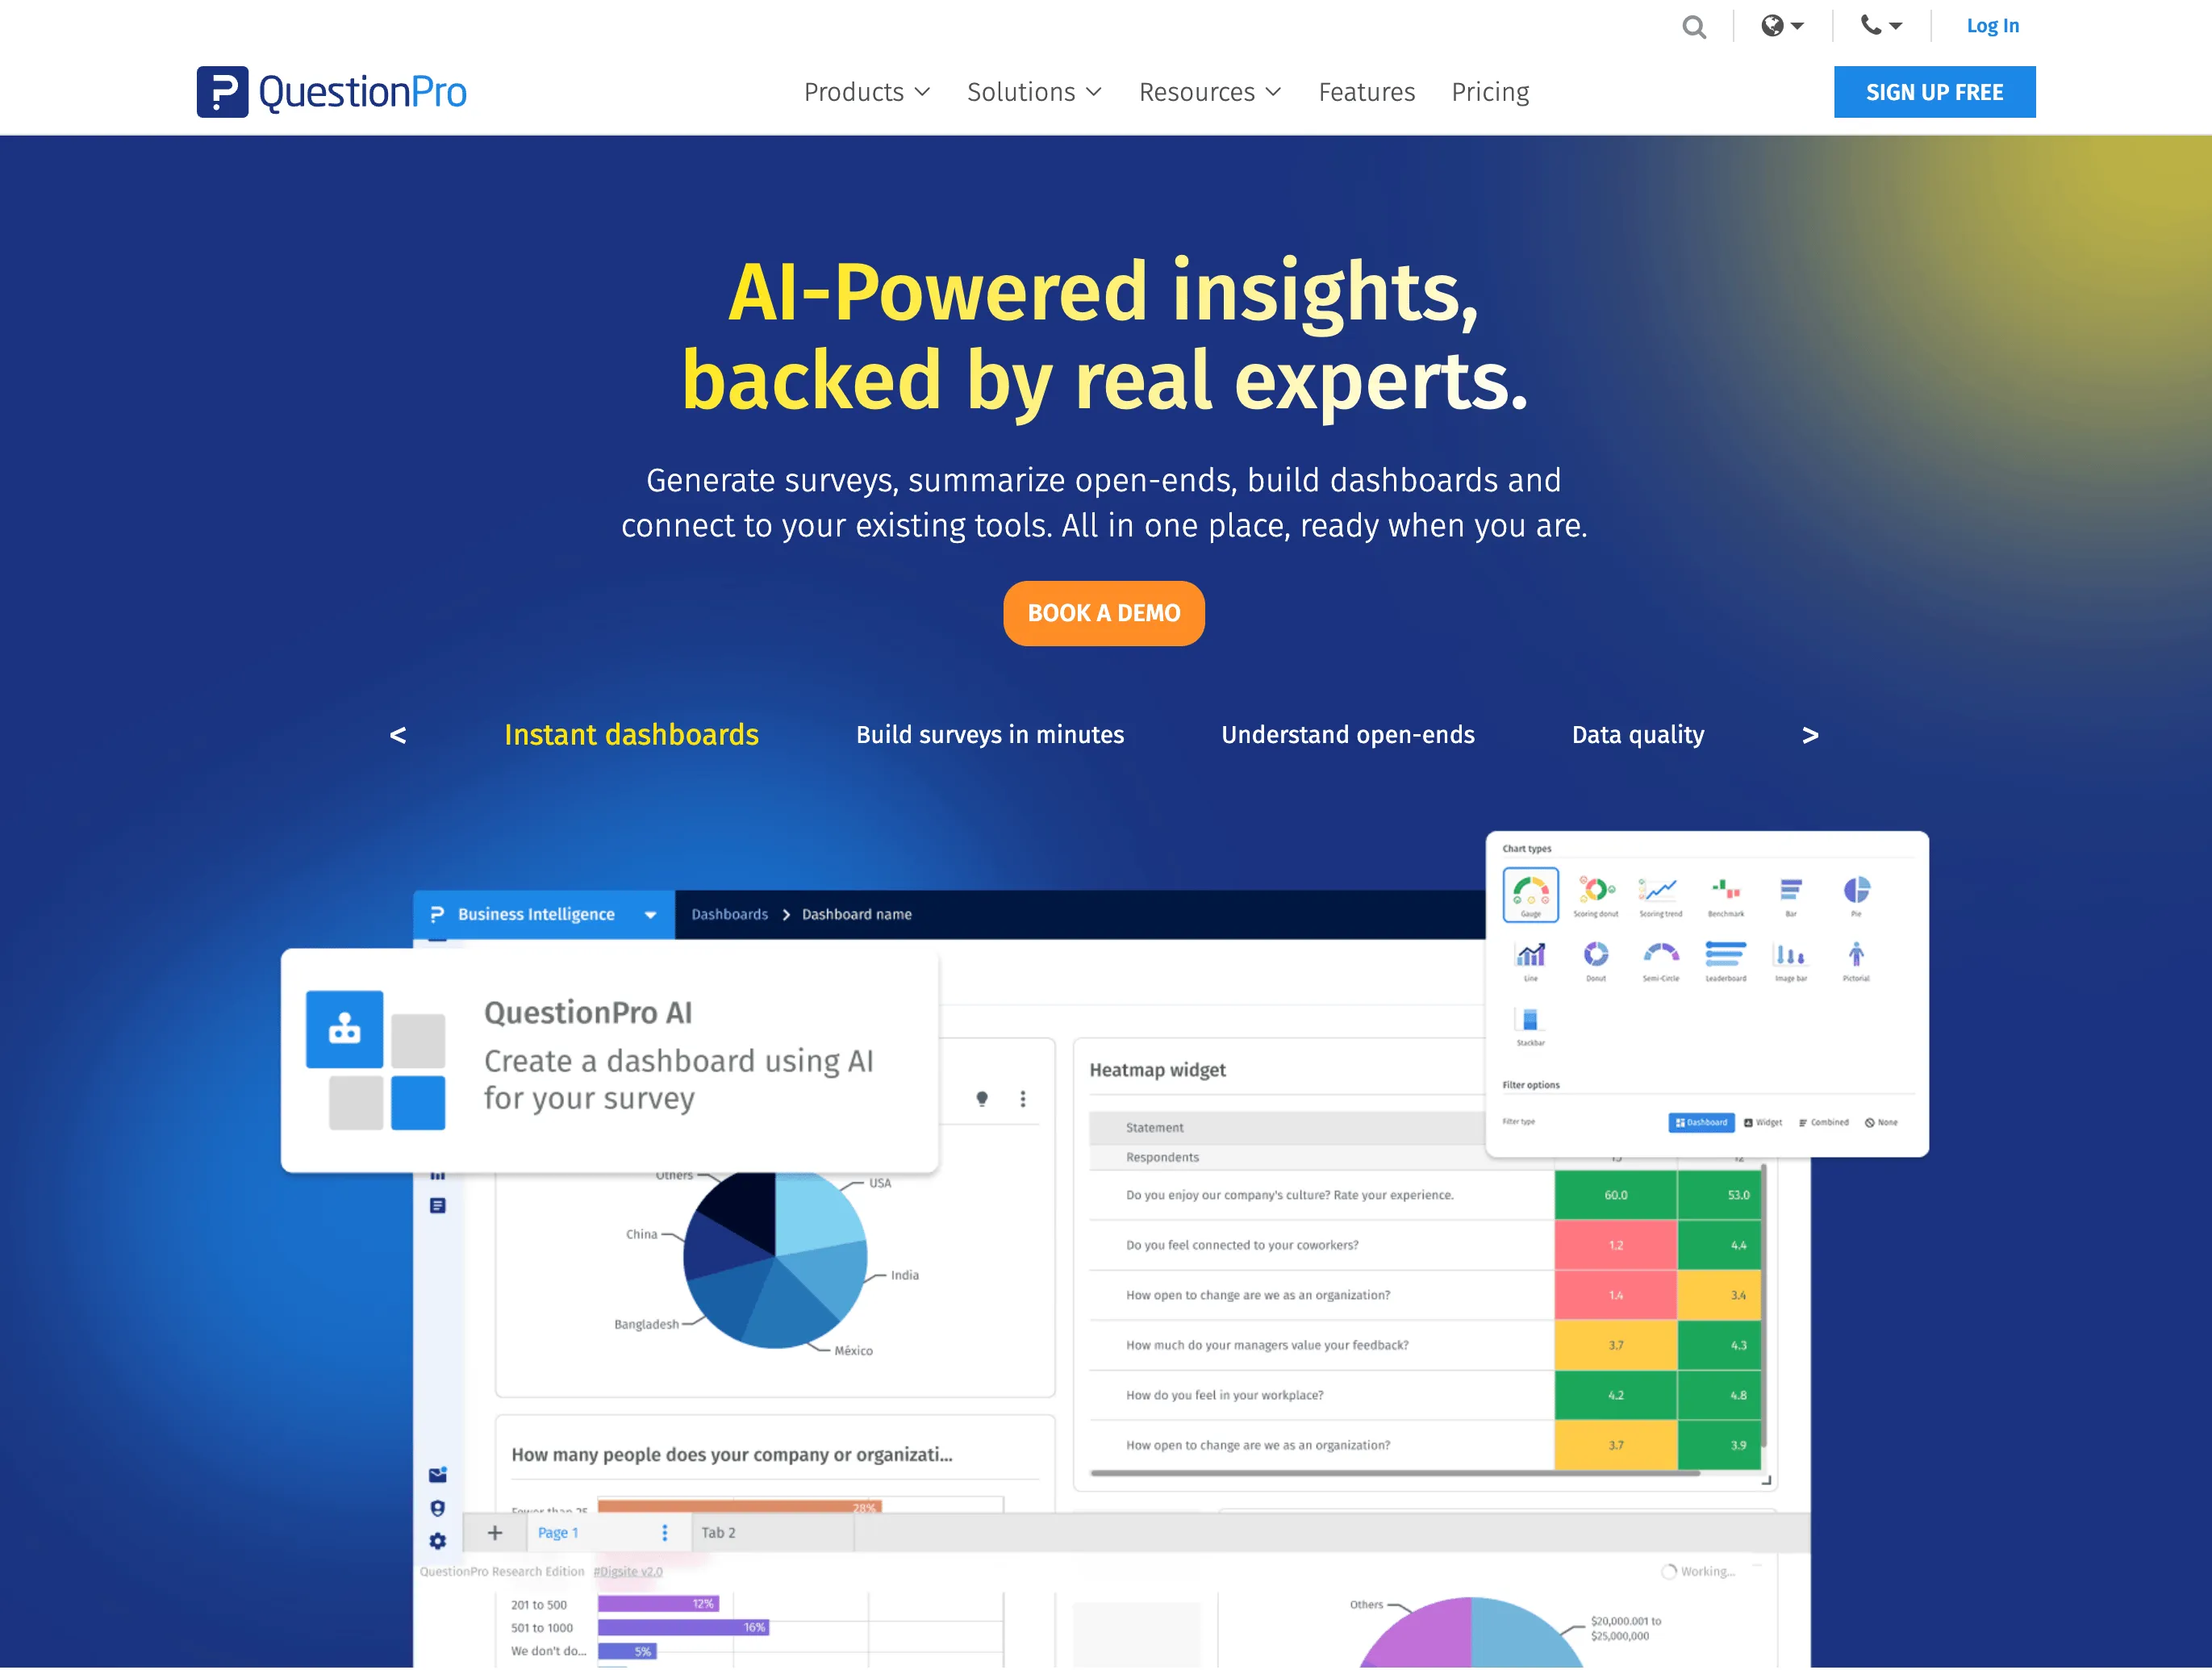
QuestionPro — Enterprise-grade research platform with extensive templates, advanced logic, and broad specialized question formats (including market research use cases like conjoint and MaxDiff). Its AI features accelerate survey drafting and insight generation for larger research teams.
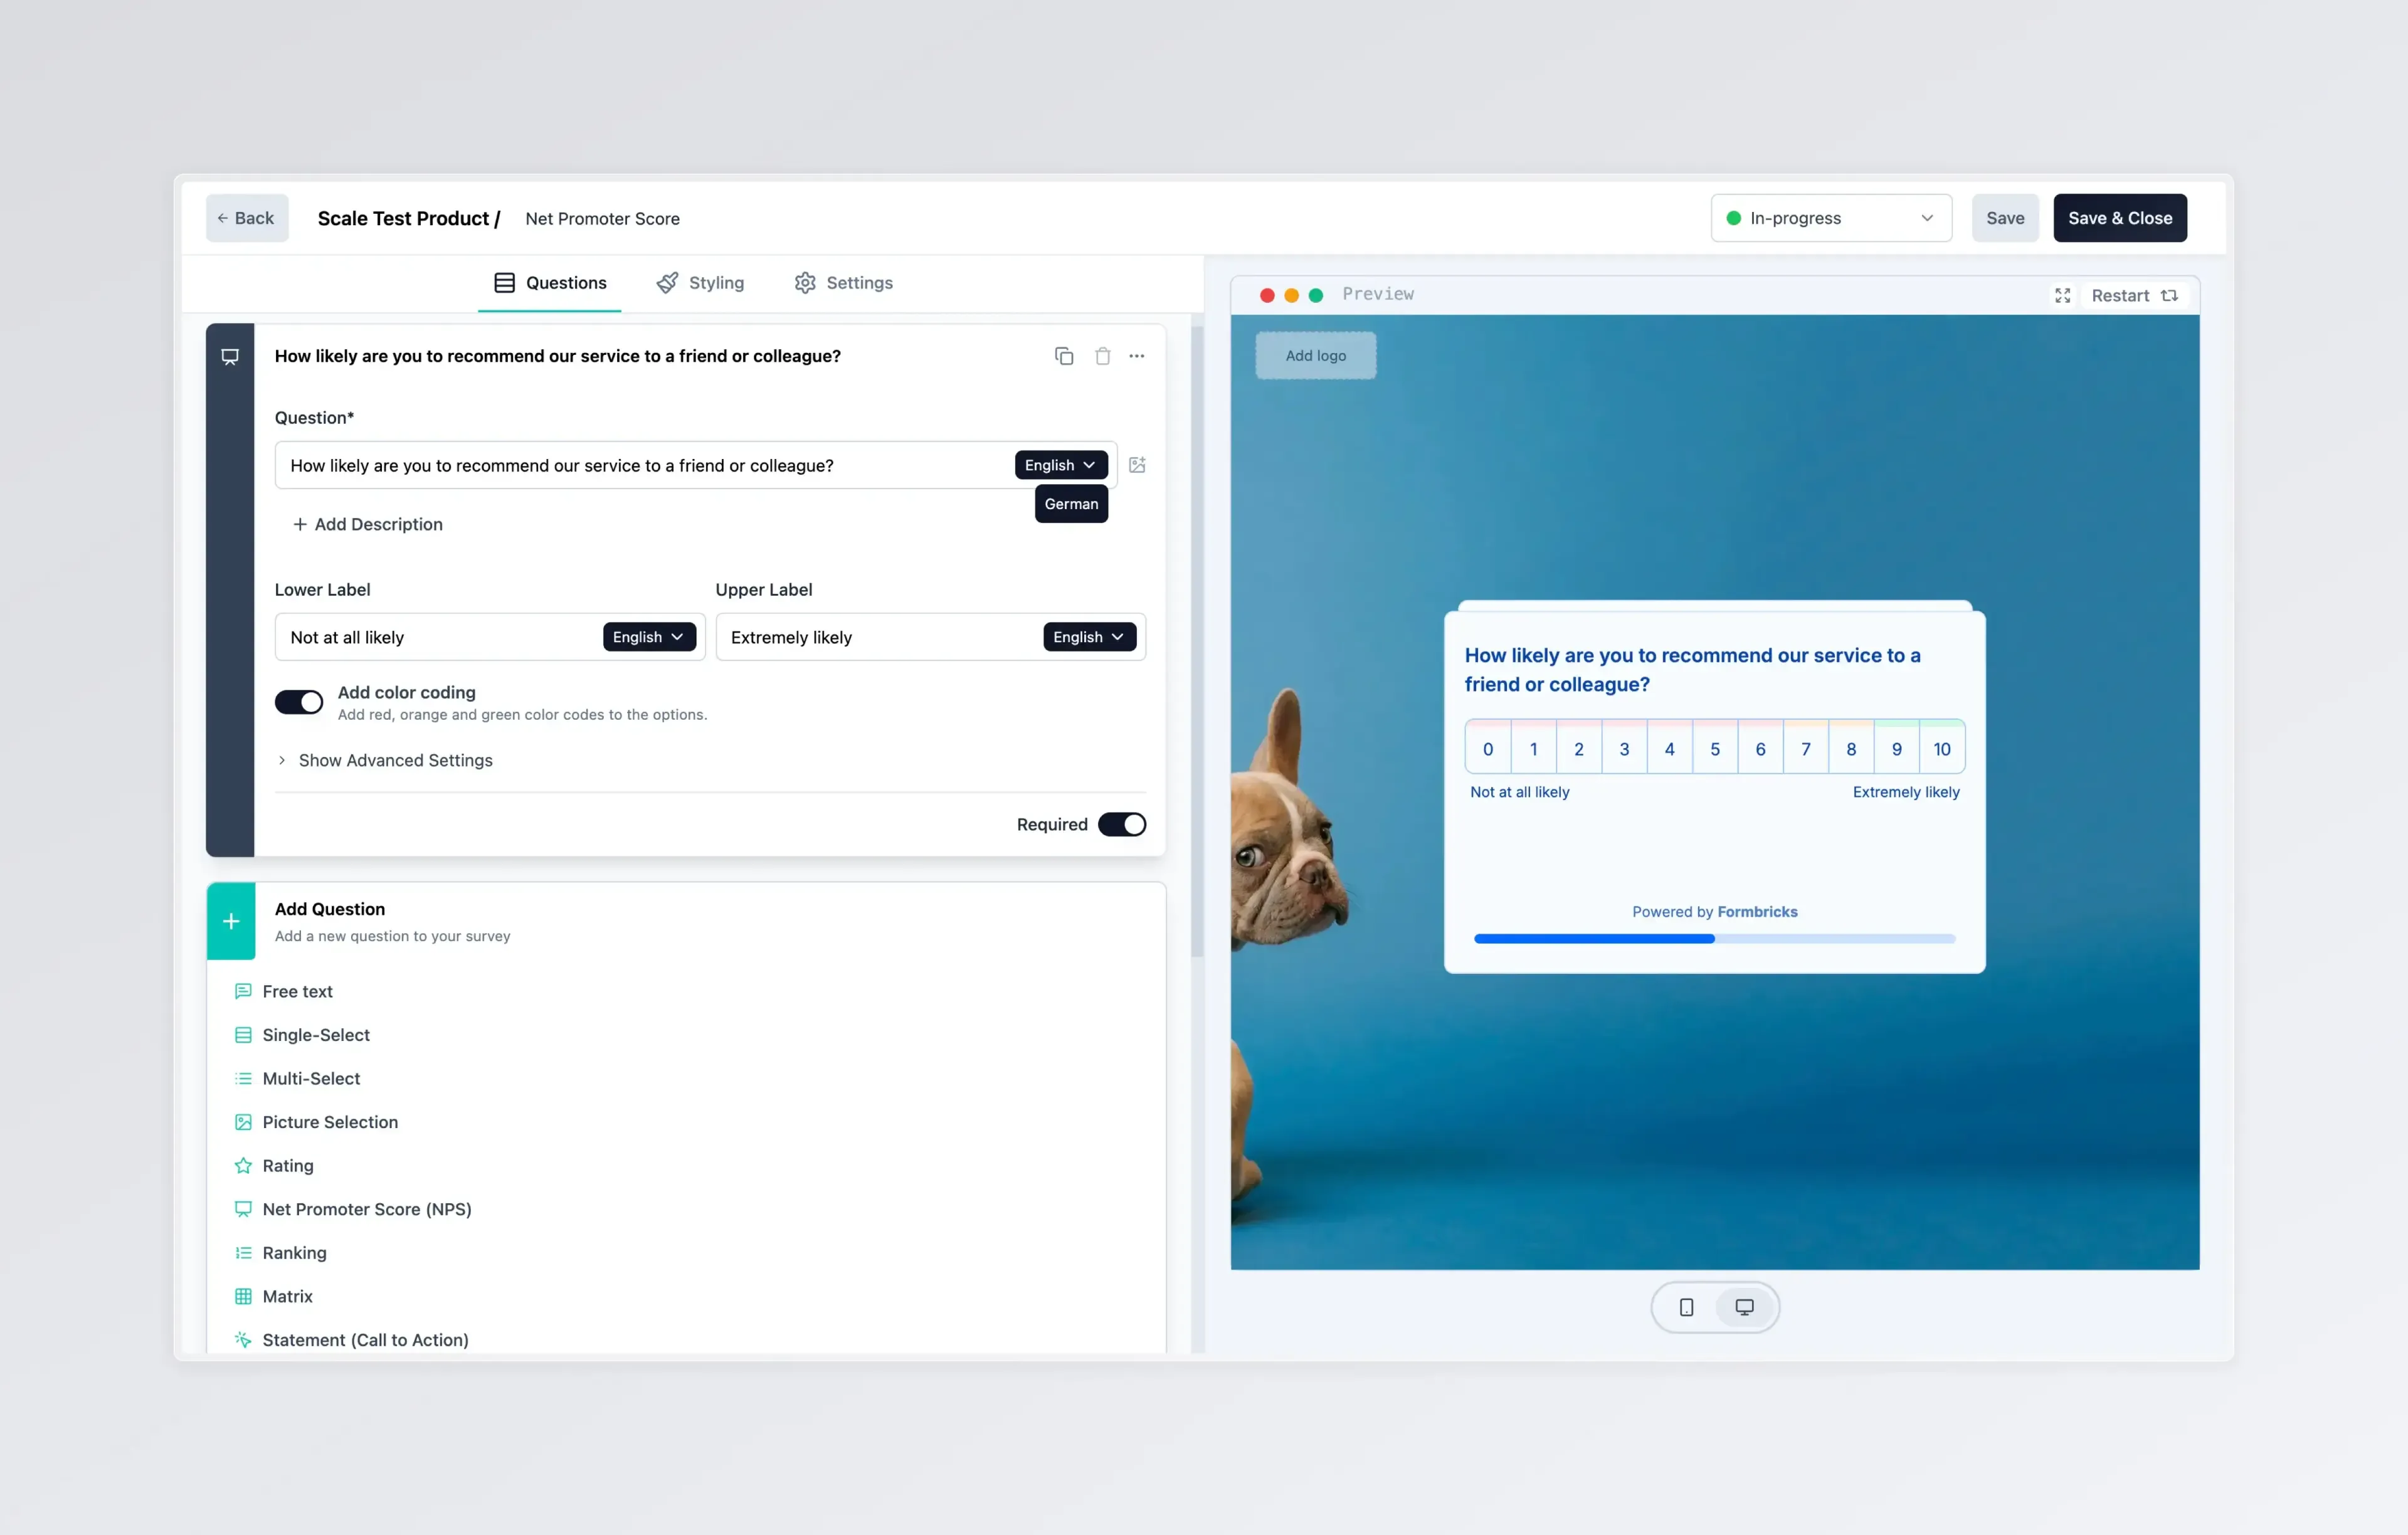
Formbricks — Open-source, developer-friendly alternative with cloud and self-hosted deployment options. Ideal for product teams that need in-app/web surveys, strong privacy control, and deeper customization via code and integrations.

SurveyMonkey — Mature, industry-standard platform with robust AI analysis features such as thematic clustering, sentiment analysis, and chat-style data exploration. A reliable choice for organizations that need scalable distribution and fast reporting across large respondent groups.
Survey Design is Complete. What’s Next?
After designing and launching your survey or form, the real work begins. Here’s how to turn collected response data into actionable insights:
1. Implement and Distribute the Survey
Launch through the right channels for your audience: email, website pop-up, social media, QR code, or in-app prompt. Ensure the survey is accessible and loads correctly on all devices.
2. Monitor Data Collection in Real Time
Track response rates as they come in. If rates are lower than expected, consider sending a follow-up reminder or checking for technical issues affecting survey access.
3. Clean and Organize the Data
Once collection is complete, remove incomplete responses, identify outliers, and organize data for analysis. AI-powered tools can automate much of this process.
4. Analyze the Data
Use the right tools for your data type. Quantitative data can be analyzed in Excel, SPSS, R, or built-in survey analytics dashboards. Qualitative open-ended responses benefit from AI-powered thematic coding and sentiment analysis.
5. Interpret the Results in Context
Always interpret findings against your original research objectives. Look for patterns, anomalies, and insights that answer the questions you set out to explore — and be honest about the limitations of your data.
6. Communicate Findings Clearly
Present results with charts, graphs, and plain-language summaries that stakeholders can act on. Avoid overwhelming reports — lead with the most important findings and use visuals to make data accessible.
7. Take Action
Insights only have value when they drive decisions. Share findings with relevant teams, define specific next steps, and set a date to review progress. The goal of any survey is to make better decisions — not to produce a report that sits unread.
8. Follow Up and Iterate
Depending on your objectives, consider follow-up surveys to track changes over time or dig deeper into specific findings. Longitudinal survey programs deliver far more strategic value than one-off data snapshots.
9. Learn and Improve Your Process
After each survey project, reflect on what worked and what didn’t. Was the response rate acceptable? Were any questions unclear? Did the data actually answer your objectives? Continuously refining your survey design process is how teams get consistently better results.
Conclusion
Effective survey design is equal parts science and craft. Get the fundamentals right — clear objectives, well-written questions, appropriate question types, and a mobile-friendly experience — and you’ll collect data you can actually trust and act on. Layer in modern AI survey tools and response-rate optimization strategies, and you have everything you need to run professional-grade research at any scale.
Ready to create your survey or form? Create a free Responsly account and start designing professional surveys and forms that get results.