Analytics & Insights

Feedback analytics that shows what to fix next

From score tracking to AI-driven themes, measure what matters and turn customer feedback into decisions — in one place.

  1. Red bull
  2. Schindler
  3. Bayer
  4. Booksy
  5. KraftHeinz
  6. Danone
Athena dashboard with NPS analytics, topic impacts, and AI insights
The difference

Most teams collect responses. The best teams act on them.

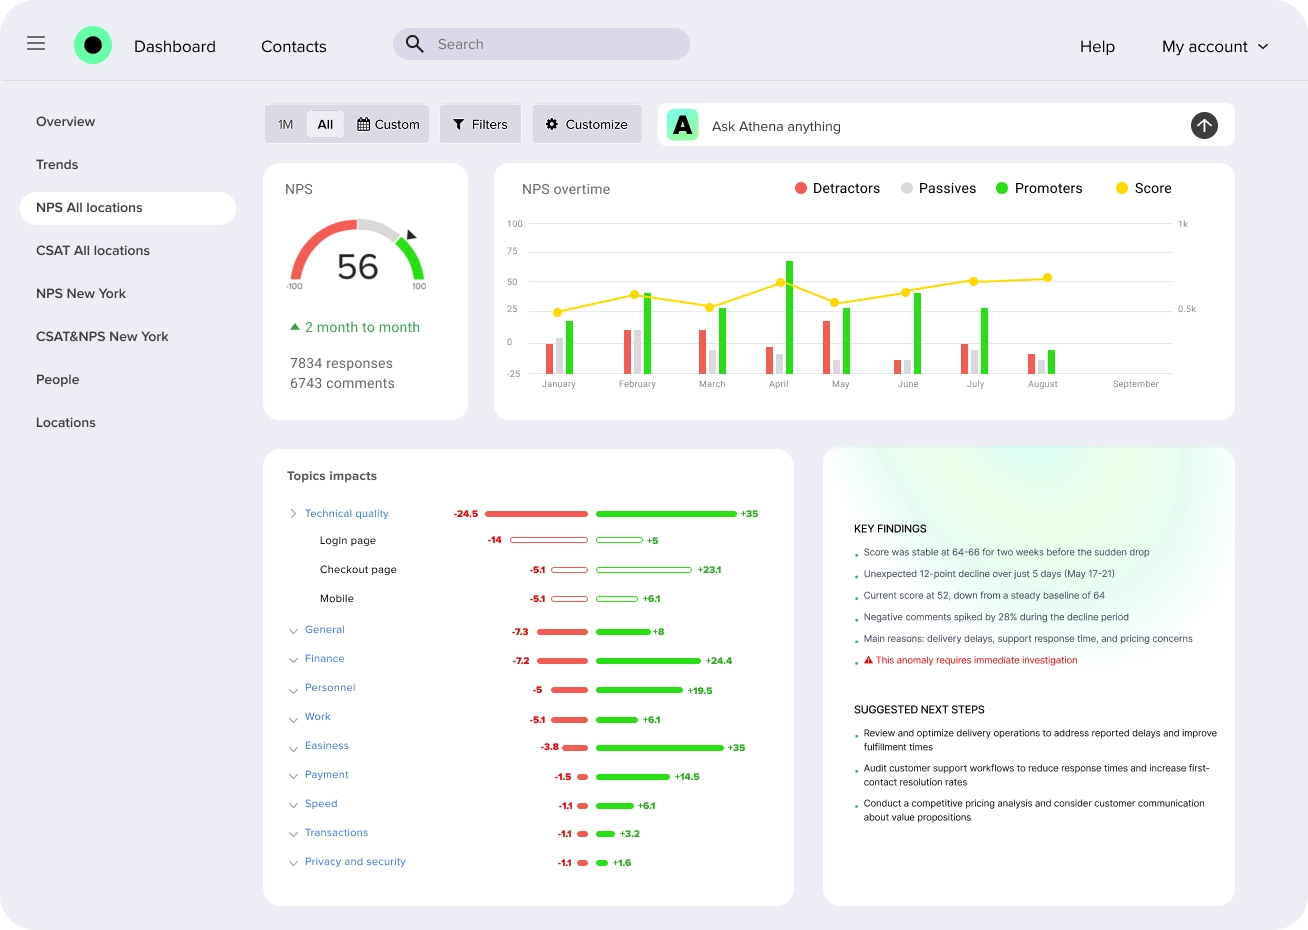
Score tracking in real time

NPS, CSAT, and CES in live dashboards — filtered, segmented, and benchmarked from day one.

AI-powered analysis

Ask Athena what changed and why. Themes, sentiment, and drivers surfaced automatically — not just charts.

Insights that reach your team

Shared dashboards, scheduled reports, and alerts in Slack or Teams, so nothing stays buried in a tool.

Rich survey analytics with CSAT, NPS, CES dashboards and score comparisons
How it works

Measure, understand, and act in a single loop

Measure

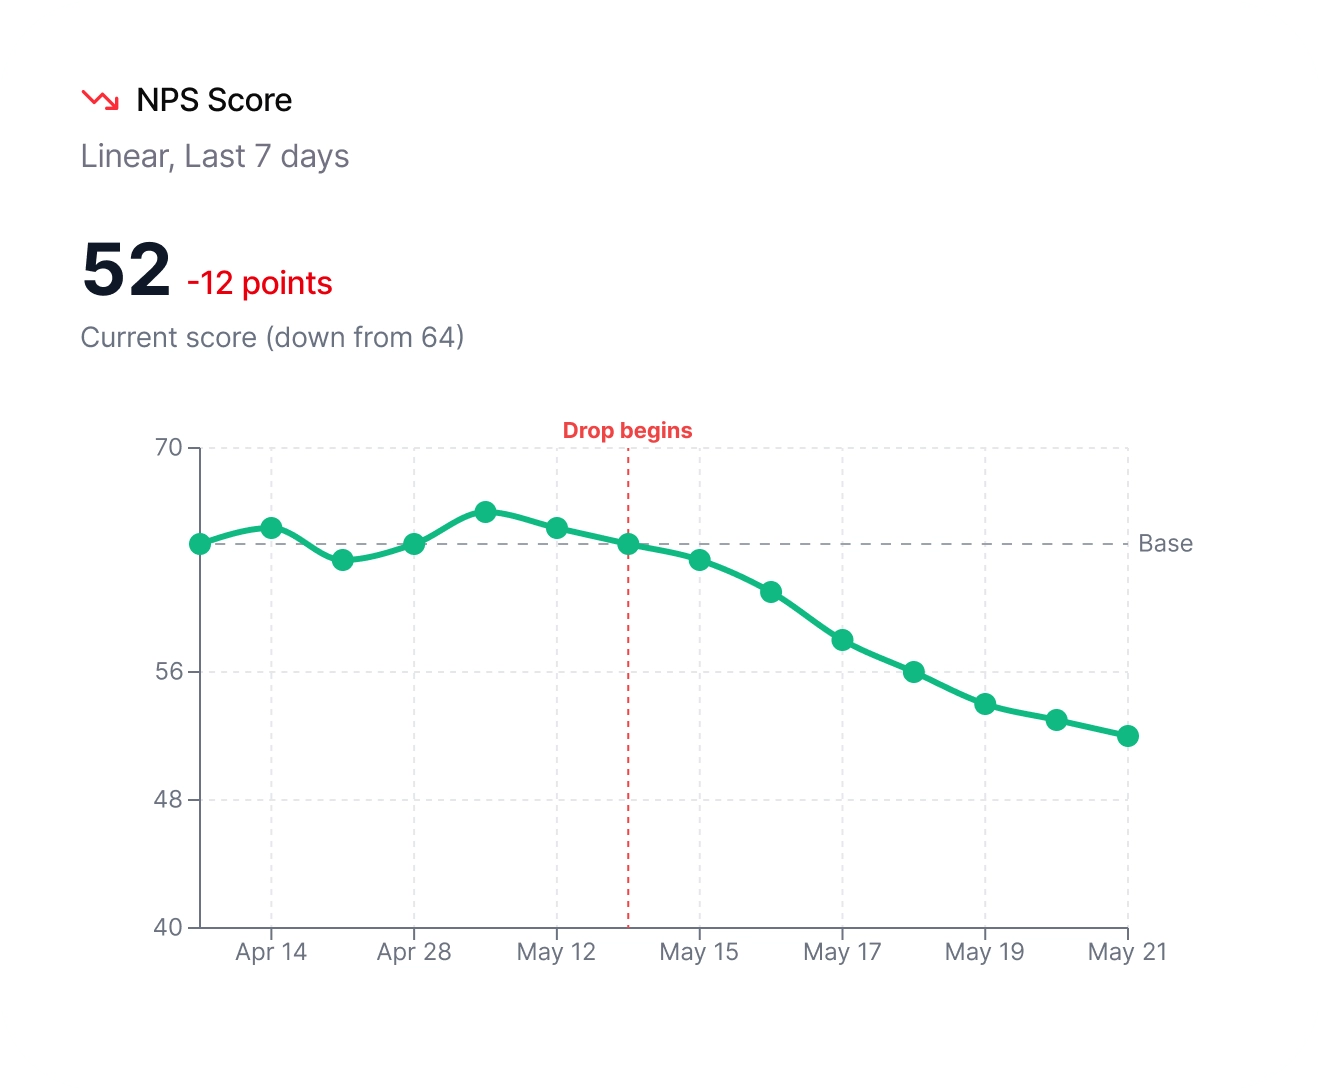
Track every score as it moves

Follow NPS, CSAT, and CES day by day in live dashboards. Compare segments, spot trends against your baseline, and see exactly when a shift started.

  • Live dashboards for NPS, CSAT, CES, and custom metrics

  • Filters and segmentation by audience, channel, or attribute

  • CSV and Excel exports, scheduled email summaries

Explore NPS software
NPS score trend dashboard showing a detected drop over time
Understand

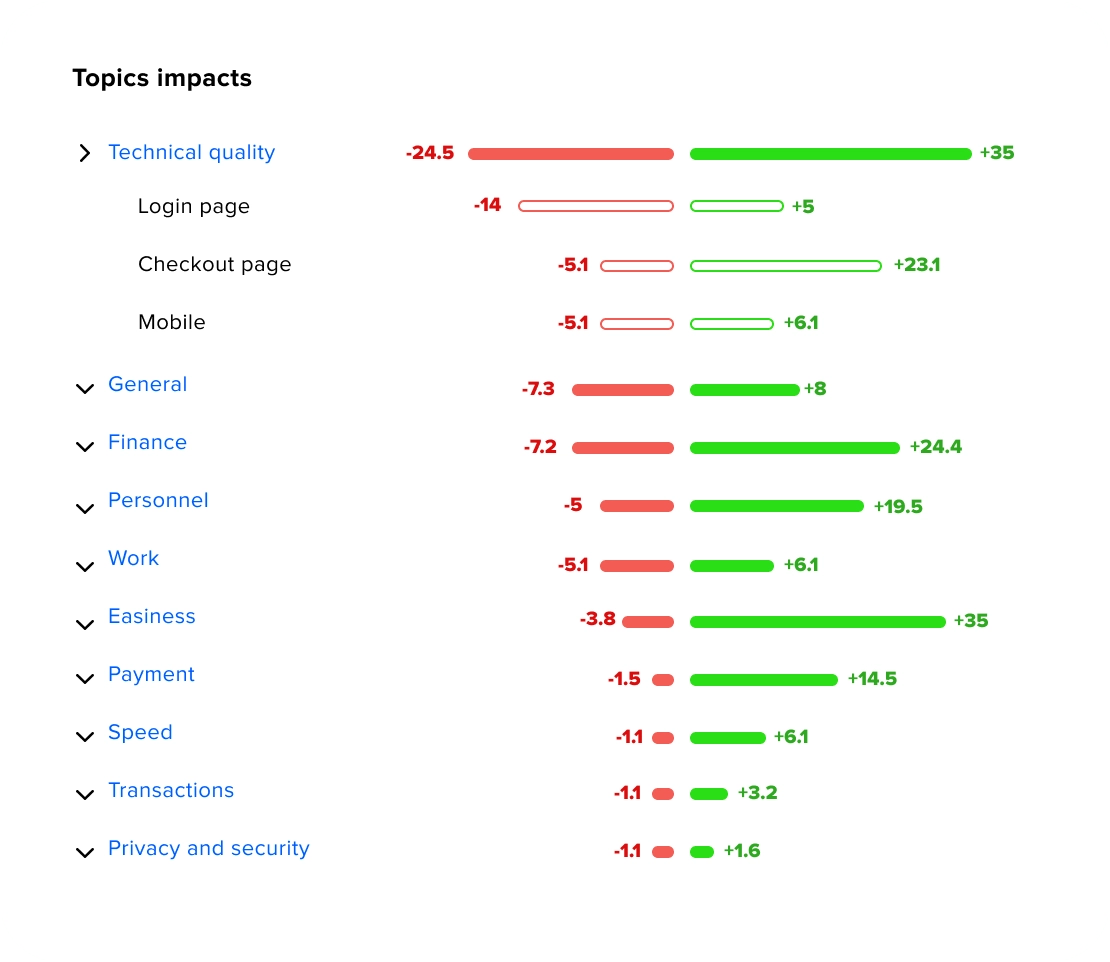
Know what moves your score and why

Athena ranks topics by their positive and negative impact on your metrics — and drills from broad categories down to checkout, login, or mobile. Open-ended feedback becomes measurable.

  • Topic impact ranking on NPS and CSAT

  • AI sentiment and theme detection on open text

  • Summaries you can hand straight to stakeholders

Meet Athena AI
Topic impact breakdown showing positive and negative drivers of NPS
Act

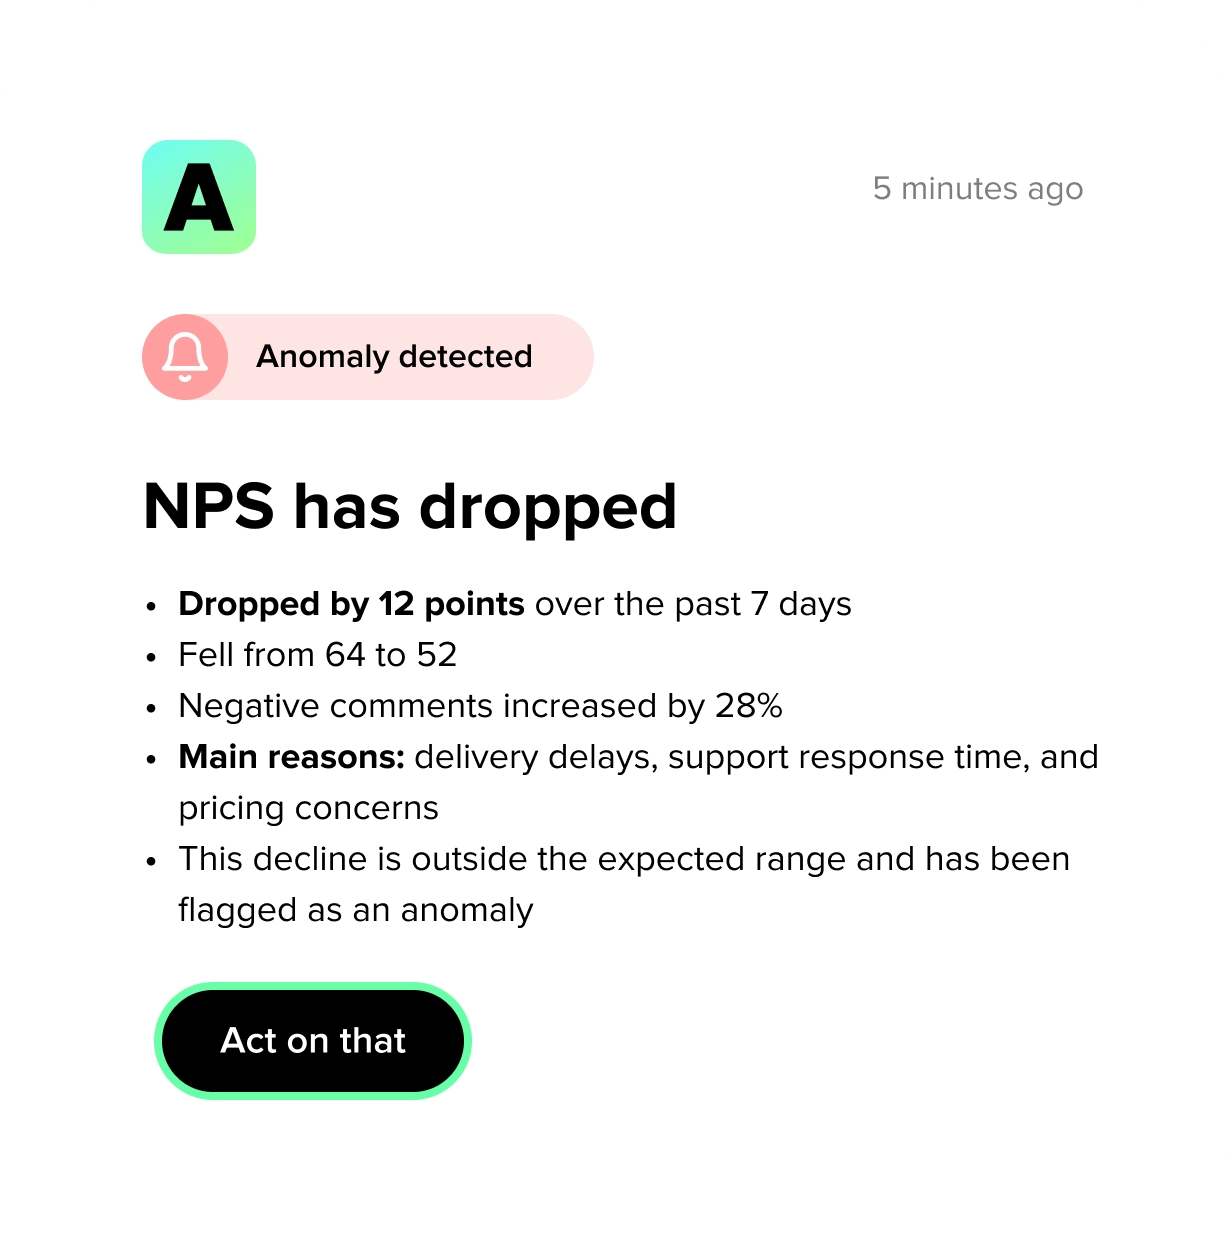
Catch dips before they become churn

When a metric moves outside the expected range, Responsly flags the anomaly, summarizes what changed, and shows the drivers behind it. Route alerts to the right team and close the loop.

  • Automatic anomaly detection on key metrics

  • Alerts in Slack, Teams, and email

  • Close-the-loop workflows through integrations

Explore integrations
Alert showing an NPS drop with anomaly detection and drivers

Feedback analytics, answered

What is feedback analytics software?

Feedback analytics software collects survey responses and customer feedback in one place, then turns them into metrics, themes, and trends you can act on. Instead of reading responses one by one, you see what changed, why it changed, and what to fix first.

Which metrics can I track with Responsly?

NPS, CSAT, CES, and any custom scores from your surveys — all in live dashboards with trends over time, segment comparisons, and benchmark context. You can filter by audience, channel, product line, or any attribute you collect.

How does AI analysis work?

Athena, our AI agent, reads open-ended responses for you. It detects themes, scores sentiment, ranks topics by their impact on your NPS or CSAT, and summarizes what changed — so qualitative feedback becomes as measurable as your scores.

Can I share results with my team?

Yes. Share live dashboards with stakeholders, schedule recurring email summaries, export to CSV or Excel, and push insights into Slack, Teams, or your CRM through integrations and webhooks.

Do I get alerted when scores drop?

Responsly flags anomalies automatically. When NPS or CSAT moves outside the expected range, you get an alert with the main drivers behind the movement — so you can respond while the issue is still small.
Talk to us!