Cross tabulation (crosstabs) builds a contingency table: a grid that shows how often each combination of answers to two questions appears. In Responsly you use this under Analysis → Crosstabs to see relationships between segments, attitudes, ratings, or other closed-ended fields—often faster than scanning separate charts for every pair.
Crosstabs help you make decisions from collected data by surfacing trends and correlations between answers. They are a standard step in survey and market research analysis.
How to create a crosstab in Responsly
- Run a survey with at least two closed questions (for example Choice or Scale).
- Open your form and go to Analysis → Crosstabs.
- Select the two questions you want to cross.
- Click Generate table to view the contingency table for that pair.
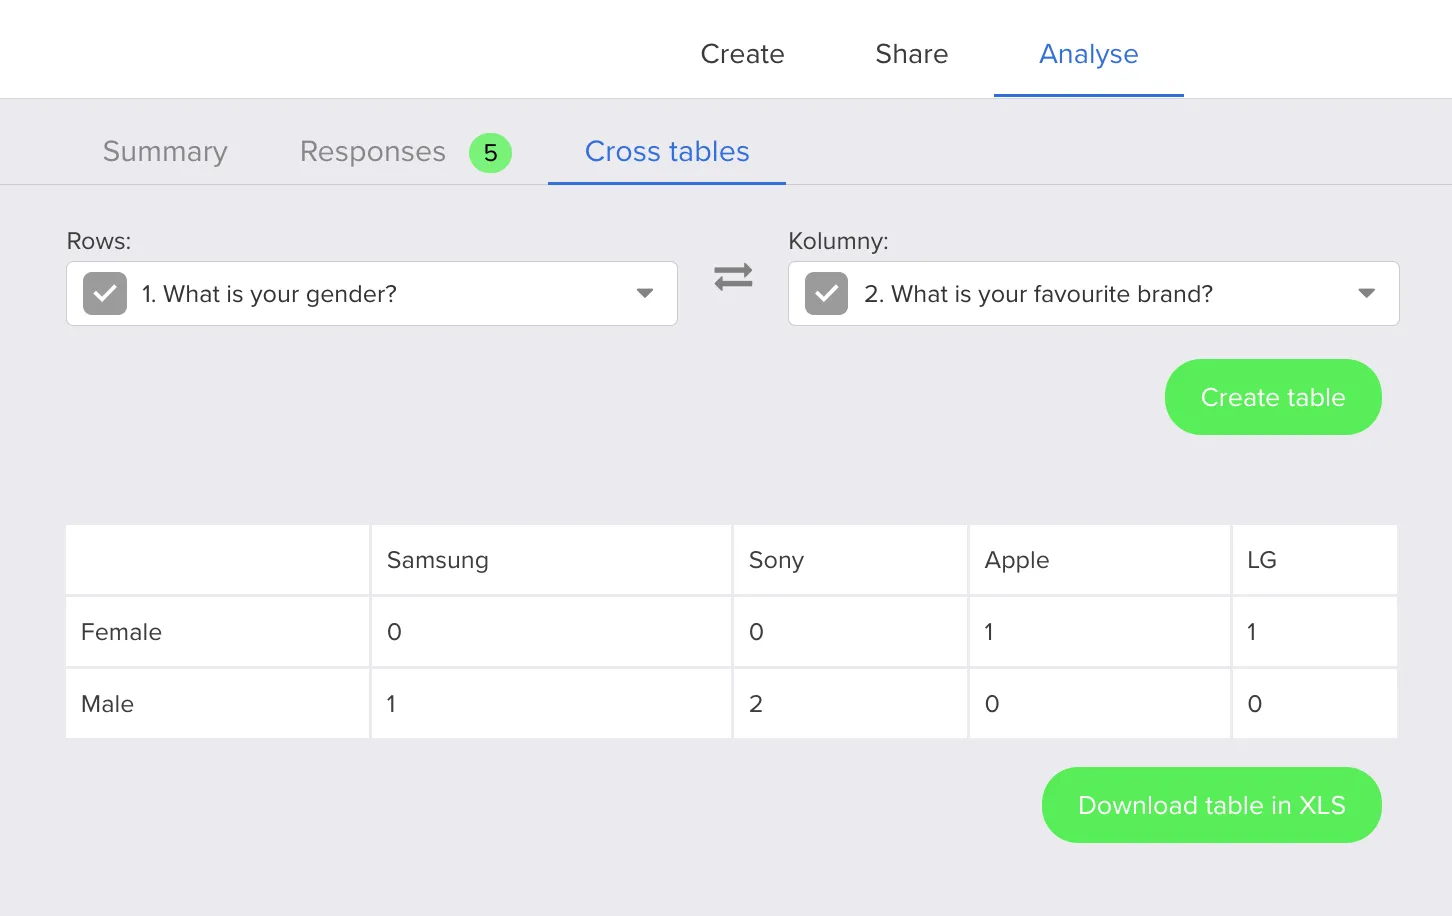
A control below the table lets you download the generated table to Excel for filtering, pivoting, or including in reports. For other export options from Analysis, see How do I export survey data?.
How crosstabs fit into broader analysis
Use crosstabs when you already know which two dimensions you want to compare (for example satisfaction by region, or product interest by role). For workflow tips on interpreting and presenting survey results, see How to analyze survey data.
