A mobile survey gives you two kinds of numbers. The Activity card on the Share → Mobile app tab shows how the survey performs in apps: how often it appeared and what people did with it. The answers themselves are in the form’s results, with all other responses.
The Activity card
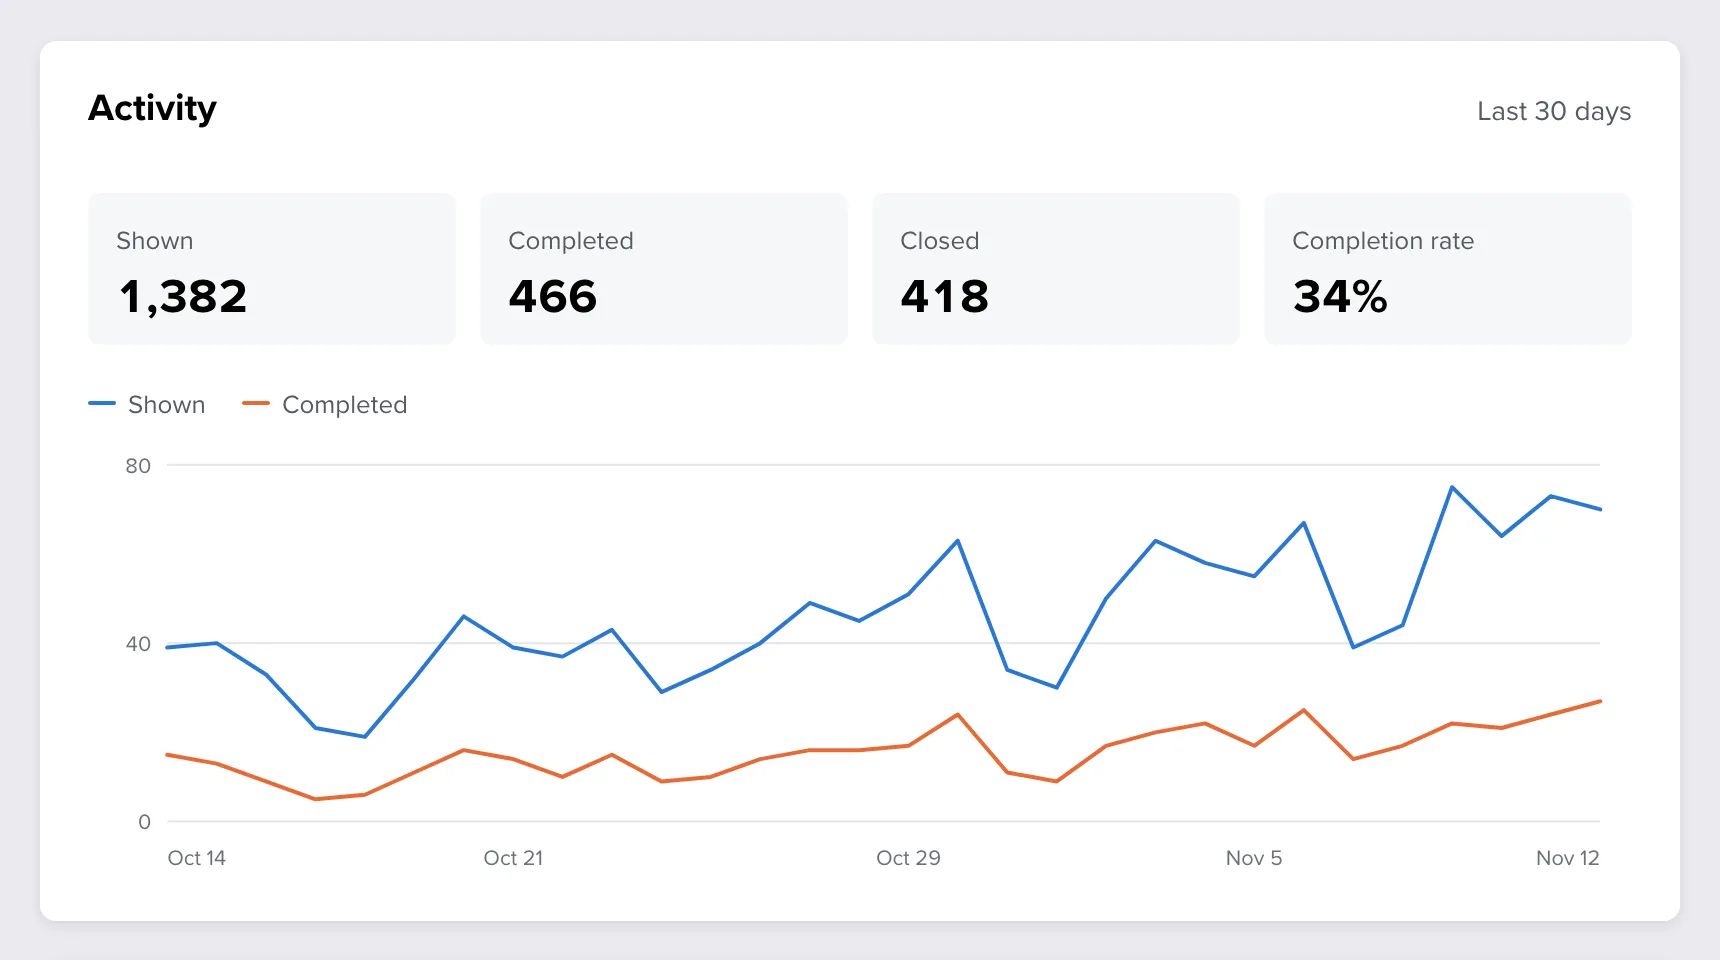
Open the form and go to Share → Mobile app. The card is at the top and covers the last 30 days.
| Number | Counts |
|---|---|
| Shown | Times the survey became visible in an app. |
| Completed | Times a respondent reached the end of the survey. |
| Closed | Times the survey was closed before it was finished. |
| Completion rate | Completed surveys as a share of shown ones. |
The chart draws the surveys shown and completed on each day. Move the pointer over the chart to read the numbers of one day, including the closed ones.
Shown is usually more than completed and closed together: some surveys are still open when the app goes to the background, and some are left by closing the app.
The card stays visible when you switch the channel off, so you keep the history of a survey that has finished.
Note: The counts are anonymous. They say how many times something happened, not who did it, and they include every platform and app of your team that showed this form.
Waiting for data
A survey that has not been shown in the last 30 days has an empty chart with Waiting for data. Numbers appear after the first display. Apps send their counts in small batches, so a display can take a moment to show up. Reload the tab to refresh.
If nothing arrives although the survey should be running, see Mobile app surveys: FAQ and troubleshooting.
Read the numbers
| What you see | What it suggests | Try |
|---|---|---|
| Few surveys shown | The trigger is rare or the audience is narrow. | A more common event, a higher Share of users, fewer conditions. |
| Many shown, few completed | The moment is wrong or the survey is too long. | A trigger after the task is done, a delay, fewer questions, a first question answered by one tap. |
| Many closed | People do not want to answer here. | Another screen, or the Bottom sheet window in a smaller size. |
| A drop after a release | The app stopped sending the event, or its name changed. | Ask your developer to compare the event names. |
Find the responses
Responses from the app are saved like any other response to the form. Open Analyse to see them.
- They are in the summary, the list of responses, crosstabs and dashboards together with responses from the link, e-mail or website.
- Each response from the app has the hidden fields your app fills, such as
user_idorplan. See Identify app users and pass data to responses. - Filter the results by a hidden field to see one group of users.
- Exports, e-mail notifications, webhooks and integrations work as they do for every response.
Tip: To tell responses from the app apart from responses through the link, add a hidden field such as
sourceto the form and ask your developer to set it toapp.
For ways to work with the answers, see How to Analyze Survey Data: Best Practices.
For developers
The app can react to answers at once, for example by asking promoters for a store review after a high NPS: Callbacks.