1) Accessing the module
- Log in to the application.
- From the top menu, select Dashboards.
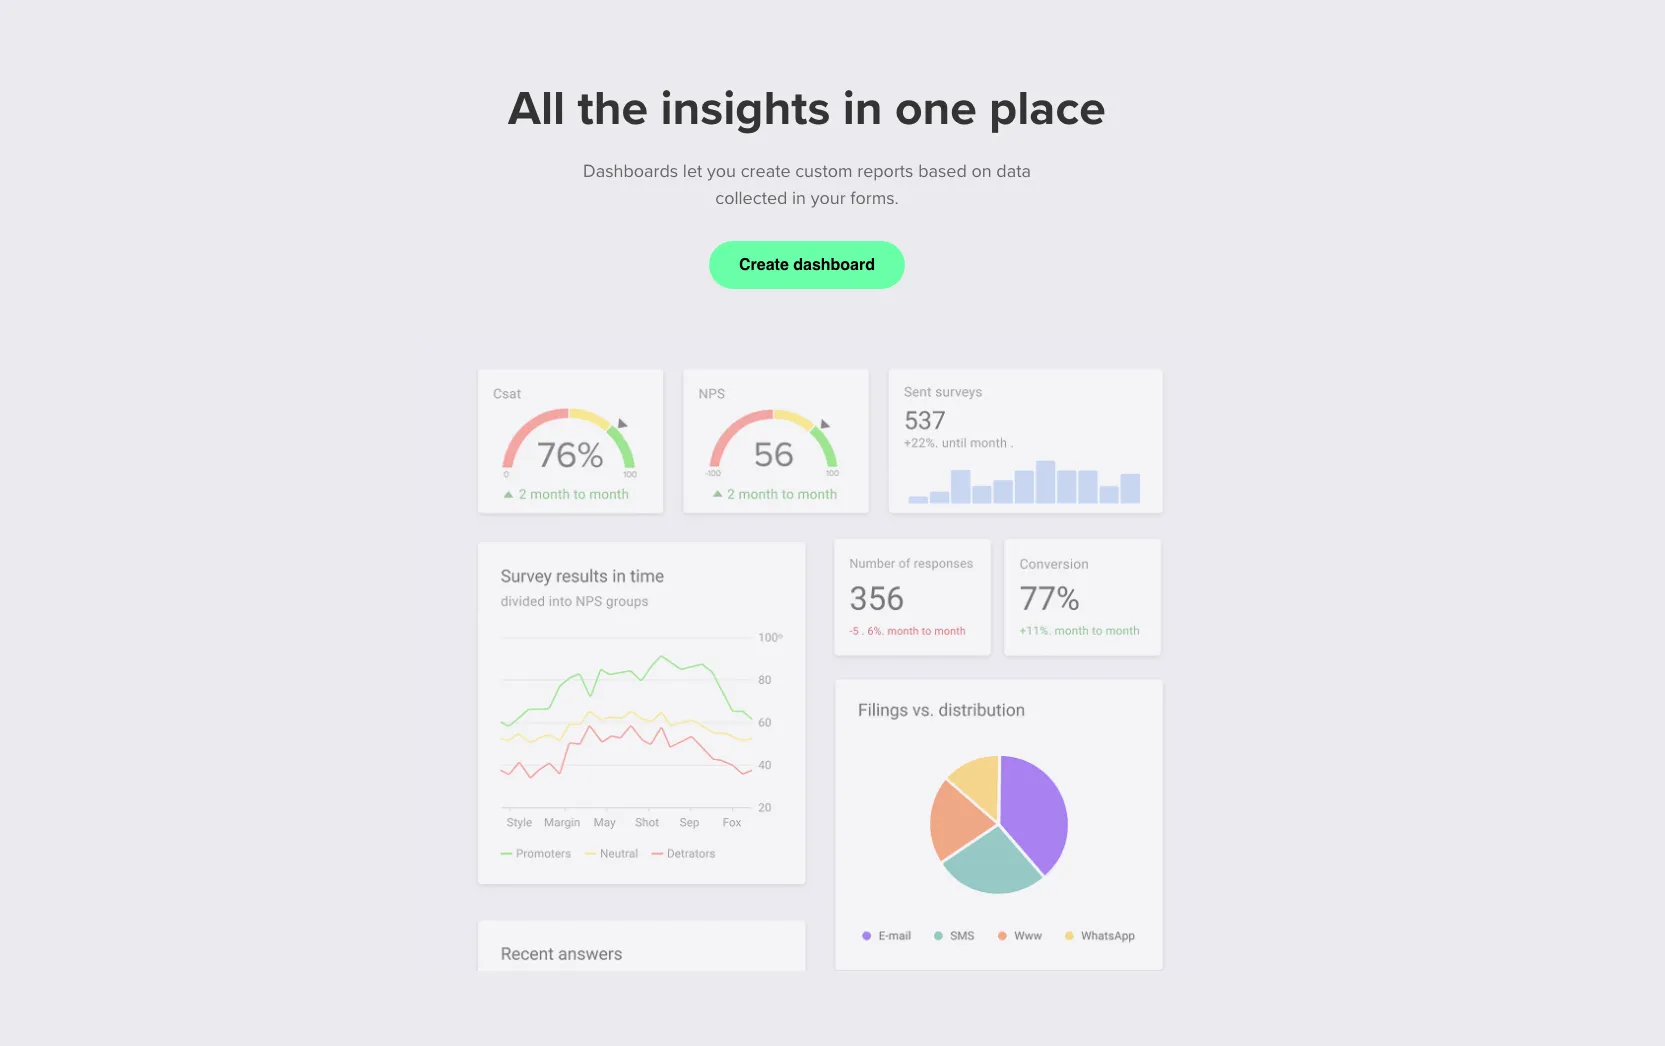
2) Creating a new dashboard
- Click Create Dashboard.
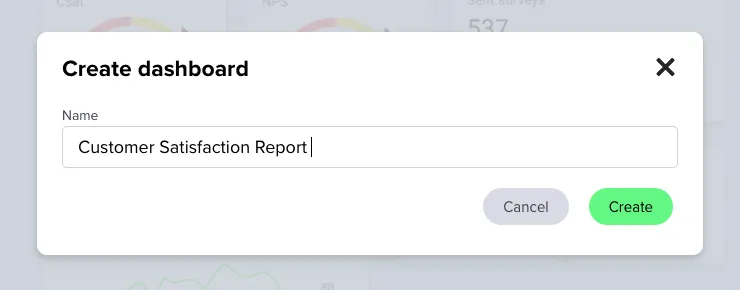
- In the Create Dashboard window, enter a name (e.g. Test report) and click Create.
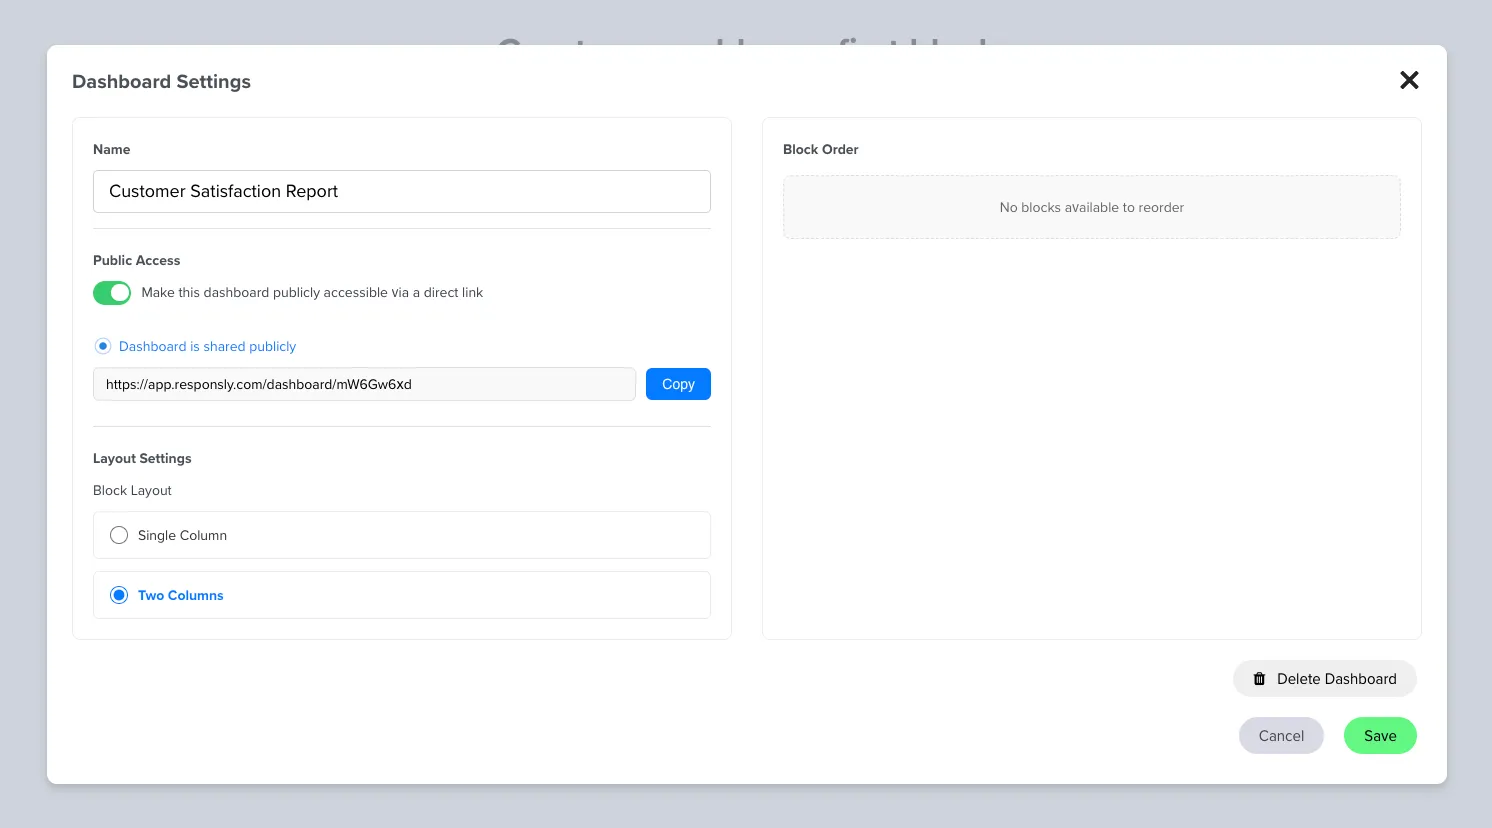
3) Dashboard settings (gear icon)
After creating a dashboard, open Dashboard settings to configure:
- Dashboard name – change the report name.
- Public access – enable to share the report publicly and copy the share link.
- Layout settings – choose Single column or Two columns.
- Block order – arrange the order of blocks (after you’ve added them).
- Click Save to apply changes.
4) Adding the first block (data section)
- On the dashboard, click + Add block.
- In the Add new block window:
- add a Block title (e.g. name of a metric or question),
- select a Date range (7d, 30d, All, or Custom).
- Click Create.
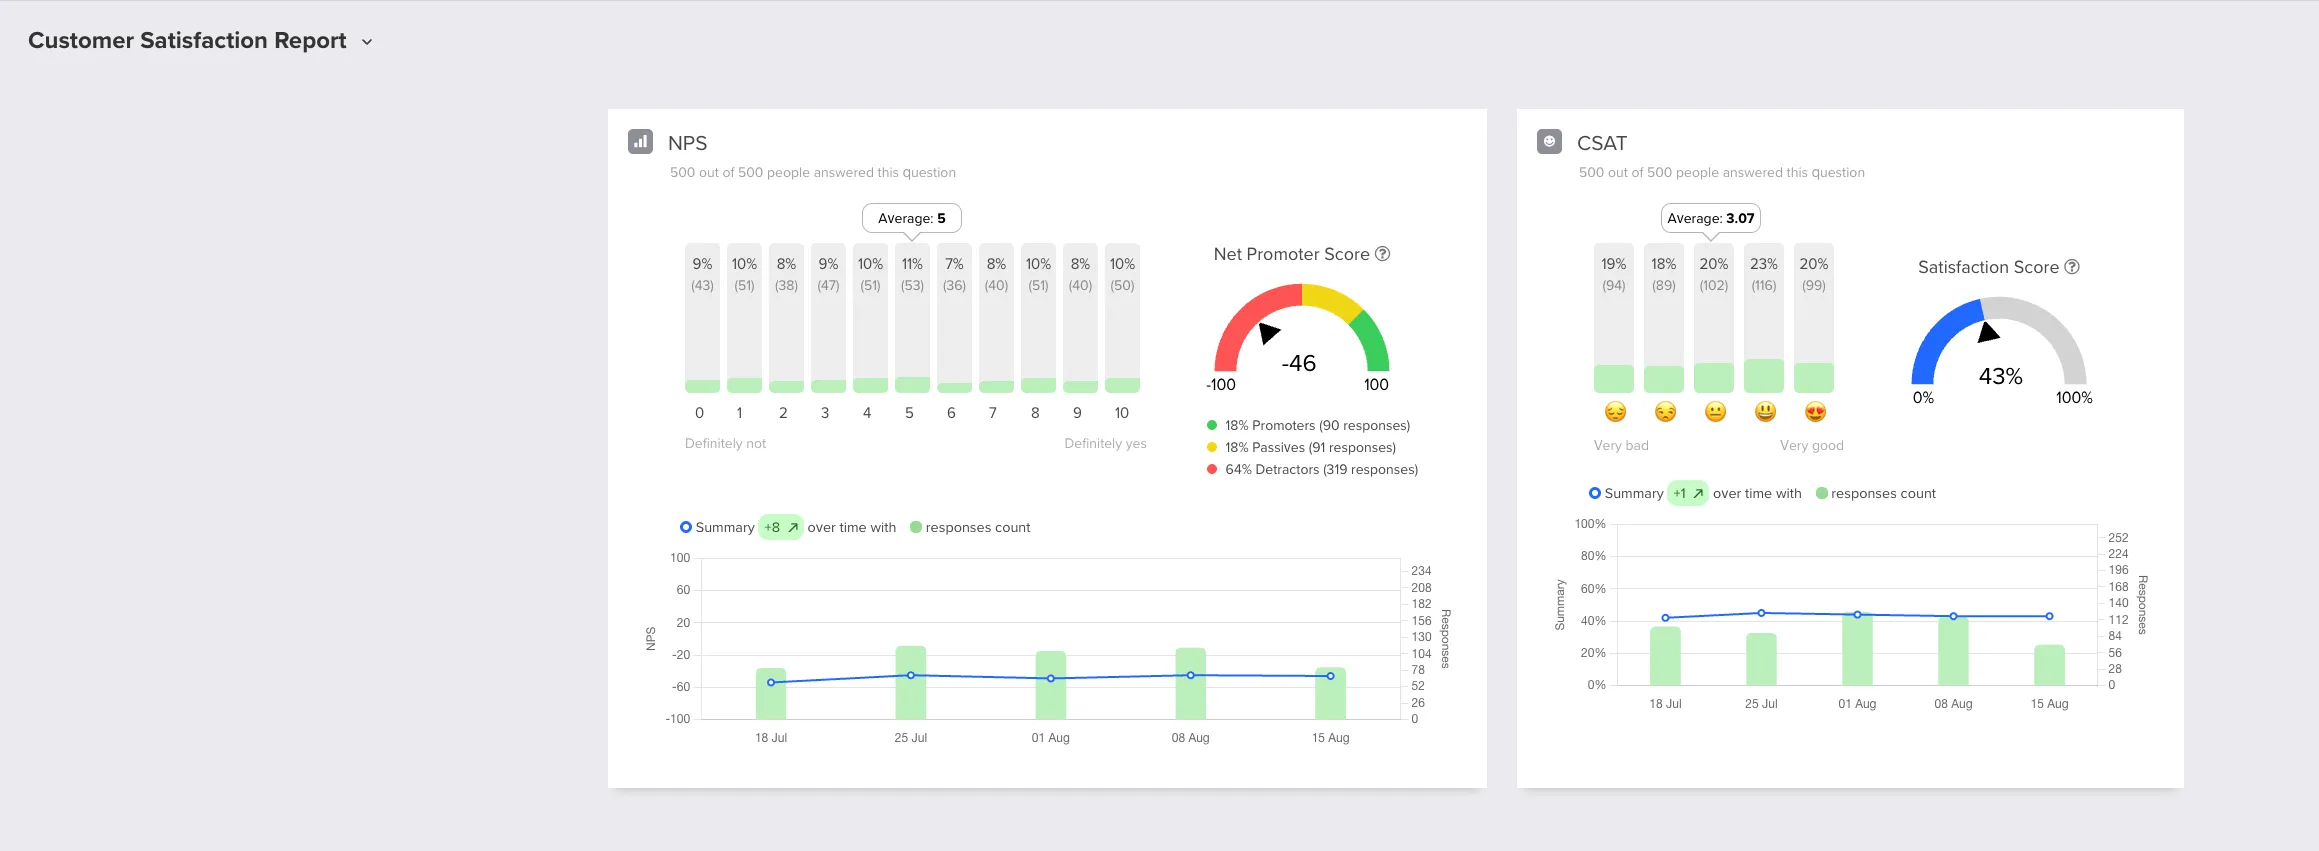
5) Connecting data sources to a block
On the block tile, click Add new source and choose one of:
- Workspace
- Form
- Question
Then:
- click Create,
- optionally use Filters to narrow the data,
- repeat adding sources for additional forms, making sure question types are the same (required for data consistency).
💡 Tip: If you see the message “Only questions of the same type can be selected to ensure data consistency”, it means each block can only combine questions of the same type (e.g. scale, single choice, etc.).
6) Adding more blocks
- Use + Add block for additional metrics or questions.
- Each block can have its own date range and data sources.
7) Sharing the report
- In Dashboard settings, enable Public access, copy the link and share it with stakeholders.
- If Public access is disabled, the report is visible only to logged‑in users with the right permissions.