


Responsly platform helps us to manage customer satisfaction and communication within our organization.
Alice Zborowska
Administration Specialist

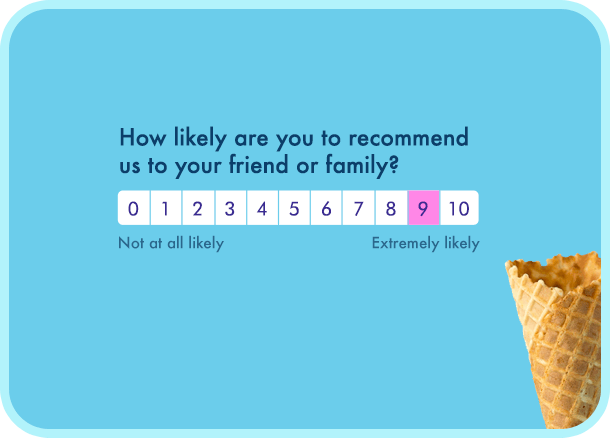





A recurring survey across your customer base — quarterly or twice a year — so you track the loyalty trend instead of a single reading.
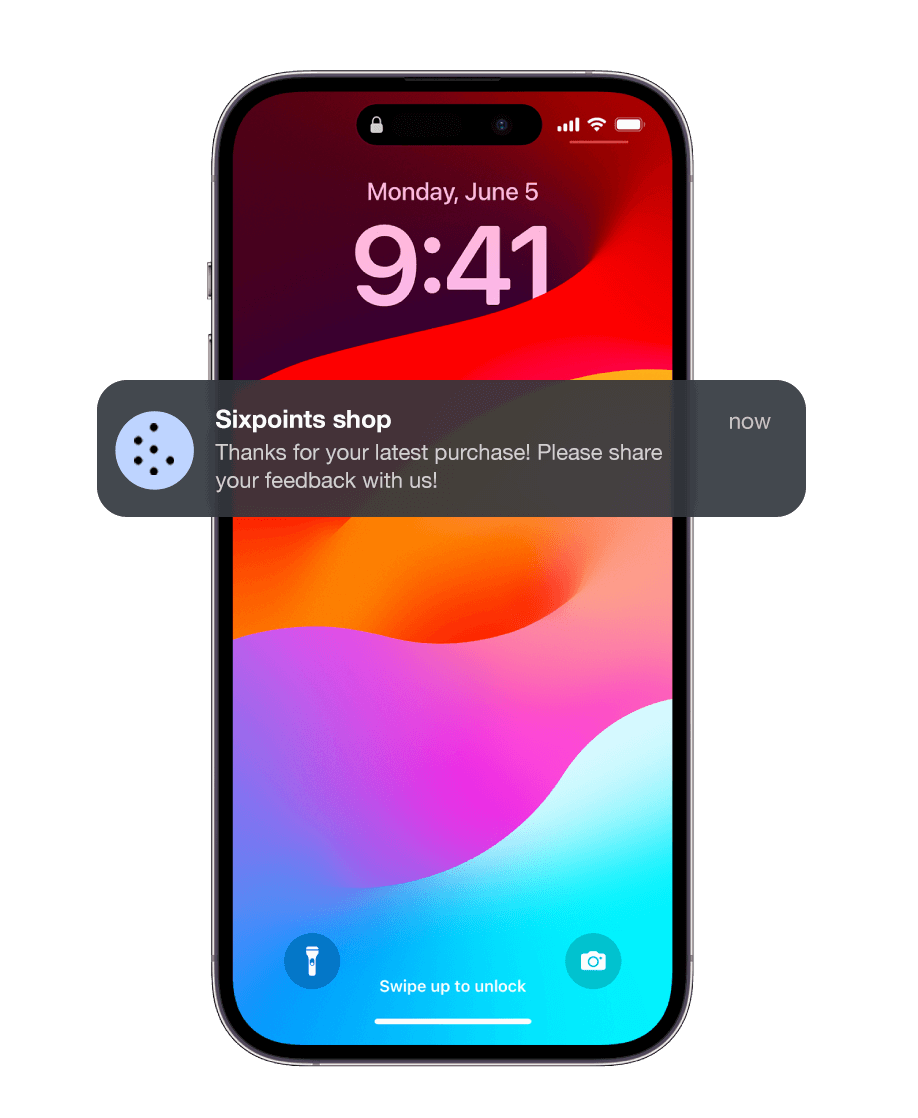
The question goes out right after a purchase, a delivery or a support conversation, while the details are still fresh.
A survey shown inside your app or website to a targeted group of users, without sending anyone off to their inbox.
The same question asked of your team: would they recommend the company as a place to work. Anonymous, with a breakdown by department.
Customer Experience platform that doesn't require lifetime to implement. In one week we implemented it across 200+ people organization.

Simon Krupnik
Marketing Director at Dombi
The NPS scale, split automatically into promoters, passives and detractors
0–10
Email, SMS, WhatsApp, a website widget and in-app surveys in one programme
5 channels
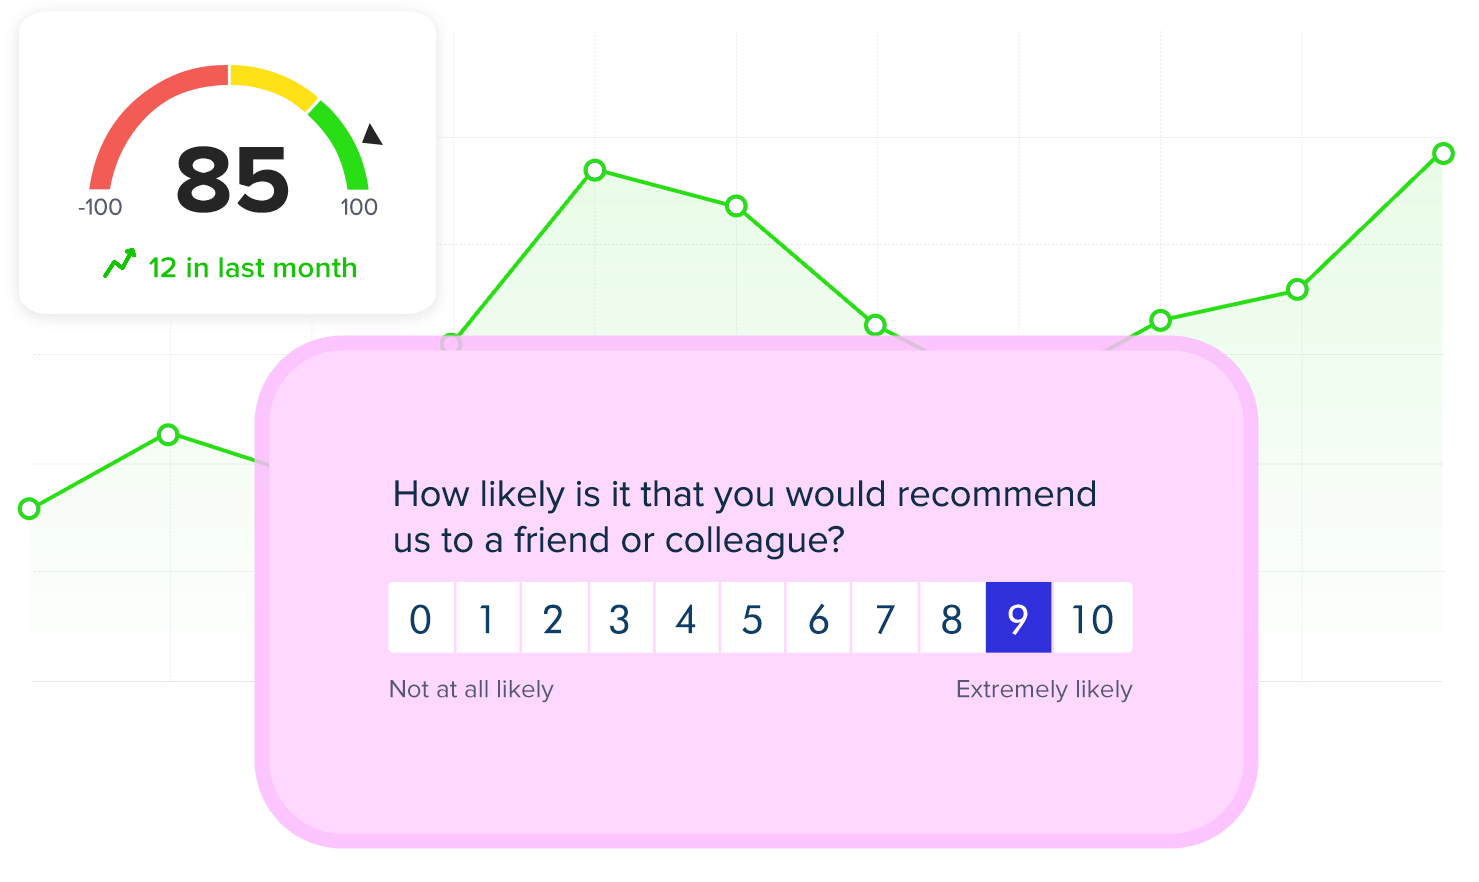
Your score recalculates with every new response, with no spreadsheets involved
Live
How long it took Dombi to roll the programme out across 200+ people
1 week
NPS survey software takes over the work around the Net Promoter Score: it sends the 0–10 question, sorts answers into promoters, passives and detractors, calculates the score, and makes sure somebody replies to the low ratings. Instead of rebuilding a spreadsheet every quarter, you have the number in one dashboard as responses come in.
Responsly is an NPS tool that pairs the standard question with follow-ups, templates and analysis of open-ended answers. You can measure NPS alongside CSAT and CES in the same programme, or read the method in our guide to calculating Net Promoter Score.
Six steps from the first question to a score your team actually uses.
Decide whether you track the relationship on a cadence or a specific event — a purchase, a delivery or a support ticket.
Start from a template: the 0–10 recommendation question plus one open question about the reason. Short surveys collect more answers.
The same questionnaire goes out by email, SMS, link, QR code, a website widget or inside your product.
The number recalculates automatically and you can filter it by segment, channel, product or location.
A low rating triggers a Slack alert or a task in your CRM, so the answer reaches the right person the same day.
Compare the score with your previous round and with your industry average, then agree how far you want to move it.
Want the methodology first? Read how to calculate NPS or see what changes when you add sentiment analysis to the score.
Net Promoter Score is calculated by subtracting the percentage of detractors from the percentage of promoters:
NPS = % Promoters − % Detractors
Respondents are grouped by their 0–10 rating: promoters (9–10), passives (7–8), and detractors (0–6). If 50% are promoters and 20% are detractors, your NPS is 30. Scores range from −100 to +100.
Responsly calculates the score automatically as responses arrive — no spreadsheets needed. For a full walkthrough, read how to calculate Net Promoter Score, and compare your result with your industry in the NPS calculator.
Every low rating reaches somebody who can act on it. A fixed problem is far more likely to end in another purchase than silence after a survey.
Athena reads the open answers under each rating, groups the recurring reasons and shows which one drags your score down the most.
The trend matters more than a single reading. The NPS benchmark calculator shows how you compare with your industry.
Collecting scores is only half the job. Closing the loop means following up with detractors, thanking promoters and routing each response to the team that can change something. Responsly connects NPS to Slack, email alerts and your CRM so nothing sits unanswered.
Go further with Athena, our AI customer intelligence agent — it watches the trend, flags unusual drops and suggests what to fix. Pair the quantitative score with the qualitative analysis described in our guide to net sentiment score.
Start from a ready-made NPS survey and change the follow-up questions, the look and the way you send it.
Trigger a survey from a CRM event, push scores into Slack and your data warehouse, and turn low ratings into tasks — through 100+ integrations, webhooks and the API.







The standard scale, split into promoters, passives and detractors
One question for a detractor, another for a promoter, based on the rating
The score recalculates with every new response
Compare rounds and see whether the number is moving
Filter the score by product, location, channel or customer group
Set a cadence and stop the same customer being asked too often
A low rating goes straight to Slack, email or your CRM
Athena groups the reasons behind ratings and surfaces recurring issues
Compare your score with the average in your industry
Email, SMS, WhatsApp, link, QR code, website widget and in-app
EU data storage, consent handling and access control on results
Share a dashboard with your board or export the data to Excel



We're compliant with General Data Protection Regulation (GDPR) that businesses in Europe must comply with when processing personal data.
USA state of California introduces California Consumer Privacy Act (CCPA) that defines how to handle users' personal data.
All connections are protected by TLS 1.2 and AES with a 256-bit key. Enable 2-Factor Authentication for even better security.
Sign up users with Single Sign-On (SSO) and manage their access to your team. Set permissions and resource access.

Responsly platform helps us to manage customer satisfaction and communication within our organization.
Alice Zborowska
Administration Specialist
Customer Experience platform that doesn't require lifetime to implement. In one week we implemented it across 200+ people organization.
Simon Krupnik
Marketing Director at Dombi
We decrease the drop rate from our surveys by 40% after moving to Responsly
Alice Matyla
CX Manager

Responsly platform help us get to know our customers better and increase the quality of our services.
Aneta Pezda
Internal Communication Specialist

Monitoring customer experience is easy with Responsly. The survey builder is incredibly user-friendly.
Robert Blok
Customer Experience Manager





You can modify this template in every possible way.
All templates work great on every device.
Use template Open form in a new window